

The follo w in g table shows the revenues (in m illions o f dollars) fo r
Question:
The follo w in g table shows the revenues (in m illions o f dollars) fo r The Gap, Inc., and American Eagle O utfitters, Inc., for the years 2008–2010.
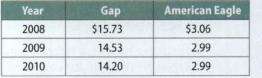
a. Calculate the average grow th rate fo r each firm .
b. W hich firm had the higher grow th rate over the 2008-2010 period? R-96
Fantastic news! We've Found the answer you've been seeking!
Step by Step Answer:

Answered By
Bharti Goyal
Some points which I focus on forever in relation to study:
1. Root cause of a particular step
2. Logical thinking
3. Be specific to answer instead of vast answers
4. Consider before answering how the answer would look like being a teacher not as an student to enhance the quality of answer
0 Reviews
10+ Question Solved
Related Book For 

Business Statistics Communicating With Numbers
ISBN: 9780071317610
1st Edition
Authors: Kelly Jaggia
Question Posted:
