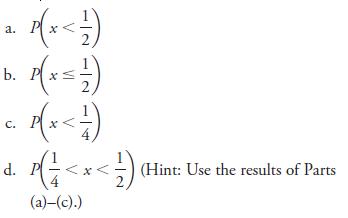
7.24 Let x denote the amount of gravel sold (in tons) during a randomly selected week at...
Question:
7.24 Let x denote the amount of gravel sold (in tons)
during a randomly selected week at a particular sales facility.
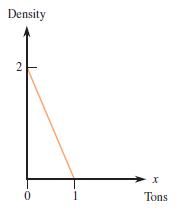
Suppose that the density curve has height f (x)
above the value x, where

The density curve (the graph of f (x)) is shown in the following figure:

Use the fact that the area of a triangle 5 12 1base2 1height2 to calculate each of the following probabilities. (Hint:
Drawing a picture and shading the appropriate area will help.)

e. The probability that gravel sold exceeds 12 ton
f. The probability that gravel sold is at least 14 ton
Step by Step Answer:
Related Book For 

Introduction To Statistics And Data Analysis
ISBN: 9780840054906
4th Edition
Authors: Roxy Peck, Chris Olsen, Jay L. Devore
Question Posted:


