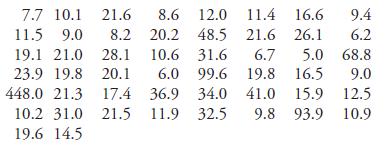
7.92 The paper Temperature and the Northern Distributions of Wintering Birds (Ecology [1991]: 22742285) gave the following
Question:
7.92 The paper “Temperature and the Northern Distributions of Wintering Birds” (Ecology [1991]:
2274–2285) gave the following body masses (in grams)
for 50 different bird species:

a. Construct a stem-and-leaf display in which 448.0 is listed separately beside the display as an outlier on the high side, the stem of an observation is the tens digit, the leaf is the ones digit, and the tenths digit is suppressed (e.g., 21.5 has stem 2 and leaf 1). What do you perceive as the most prominent feature of the display?
b. Draw a histogram based on class intervals 5 to 10, 10 to 15, 15 to 20, 20 to 25, 25 to 30, 30 to 40, 40 to 50, 50 to 100, and 100 to 500.
Is a transformation of the data desirable? Explain.
c. Use a calculator or statistical computer package to calculate logarithms of these observations, and con-
struct a histogram. Is the log transformation successful in producing a more symmetric distribution?

Step by Step Answer:

Introduction To Statistics And Data Analysis
ISBN: 9780840054906
4th Edition
Authors: Roxy Peck, Chris Olsen, Jay L. Devore


