

Ages of couples 2007. In Exercise 21 we looked at the age at which women married as
Question:
Ages of couples 2007. In Exercise 21 we looked at the age at which women married as one of the variables considered by those selling wedding services. Another variable of concern is the difference in age of the two partners. The graph shows the ages of both men and women at first marriage.
(www.census.gov)
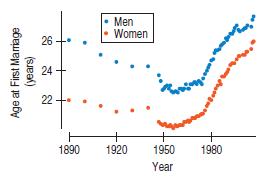
Clearly, the pattern for men is similar to the pattern for women. But are the two lines getting closer together?
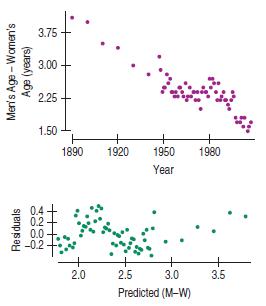
Here is a timeplot showing the difference in average age (men’s age – women’s age) at first marriage, the regression analysis, and the associated residuals plot.
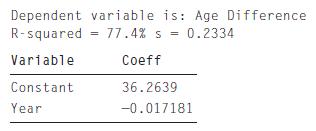
a) What is the correlation between Age Difference and Year?
b) Interpret the slope of this line.
c) Predict the average age difference in 2015.
d) Compute the Durbin-Watson statistic and comment.
e) Describe reasons why you might not place much faith in that prediction.
Step by Step Answer:

This question has not been answered yet.
You can Ask your question!


Business Statistics
ISBN: 9780321716095
2nd Edition
Authors: Norean D. Sharpe, Paul F. Velleman, David Bock, Norean Radke Sharpe
