

Carbon footprint. The scatterplot shows, for 2008 cars, the carbon footprint (tons of CO2 per year) vs.
Question:
Carbon footprint. The scatterplot shows, for 2008 cars, the carbon footprint (tons of CO2 per year) vs. the new Environmental Protection Agency (EPA) highway mileage for 82 family sedans as reported by the U.S. government
(www.fueleconomy.gov/feg/byclass.htm). The car with the highest highway mpg and lowest carbon footprint is the Toyota Prius.
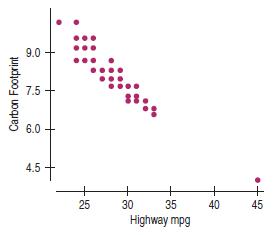
a) The correlation is . Describe the association.
b) Are the assumptions and conditions met for computing correlation?
c) Using technology, find the correlation of the data when the Prius is not included with the others. Can you explain why it changes in that way?
Fantastic news! We've Found the answer you've been seeking!
Step by Step Answer:

Answered By
Tobias sifuna
I am an individual who possesses a unique set of skills and qualities that make me well-suited for content and academic writing. I have a strong writing ability, allowing me to communicate ideas and arguments in a clear, concise, and effective manner. My writing is backed by extensive research skills, enabling me to gather information from credible sources to support my arguments. I also have critical thinking skills, which allow me to analyze information, draw informed conclusions, and present my arguments in a logical and convincing manner. Additionally, I have an eye for detail and the ability to carefully proofread my work, ensuring that it is free of errors and that all sources are properly cited. Time management skills are another key strength that allow me to meet deadlines and prioritize tasks effectively. Communication skills, including the ability to collaborate with others, including editors, peer reviewers, and subject matter experts, are also important qualities that I have. I am also adaptable, capable of writing on a variety of topics and adjusting my writing style and tone to meet the needs of different audiences and projects. Lastly, I am driven by a passion for writing, which continually drives me to improve my skills and produce high-quality work.
1+ Reviews
10+ Question Solved
Related Book For 

Business Statistics
ISBN: 9780321716095
2nd Edition
Authors: Norean D. Sharpe, Paul F. Velleman, David Bock, Norean Radke Sharpe
Question Posted:
