

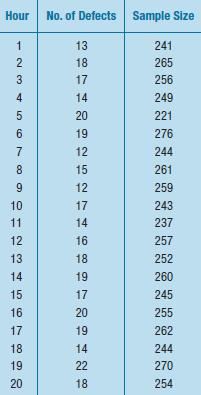
Defect monitoring, second product. The following data are from a production process that makes approximately 250 units
Question:
Defect monitoring, second product. The following data are from a production process that makes approximately 250 units each hour. The data were collected over a normal 12-hour shift one day. Historical data shows the proportion of defects to be 6.21%. Either use technology to accommodate the different sample sizes, or use 250 as an approximation for all of them.
Assuming the process was previously in control,
a) Calculate the center line.
b) Create a p chart for these samples.
c) Is this process out of control?
Fantastic news! We've Found the answer you've been seeking!
Step by Step Answer:

Answered By
Aniruddha Hossen
In my tuition, I think of myself as a student so that I can see their perspective. This helps me to understand the state of mind of my students. I love to teach step by step with easy explanations and always try to involve my students in the study. I have 2 years of teaching experience, so I am aware of how to answer a question and do assignments properly. I want to connect more students across the globe. So this time I am here to prove myself in the online platform.
0 Reviews
10+ Question Solved
Related Book For 

Business Statistics
ISBN: 9780321716095
2nd Edition
Authors: Norean D. Sharpe, Paul F. Velleman, David Bock, Norean Radke Sharpe
Question Posted:
