

Energy use, part 2. Examine the regression and scatterplot showing the regression line, 95% confidence interval, and
Question:
Energy use, part 2.
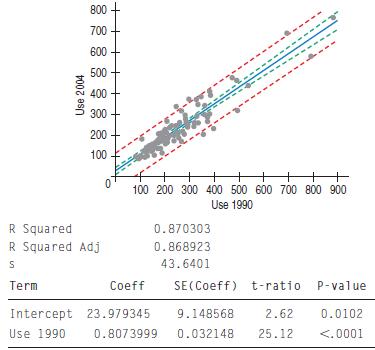
Examine the regression and scatterplot showing the regression line, 95% confidence interval, and 95% prediction interval using 1990 and 2004 energy use
(kg oil equivalent per $1000 GDP) for a sample of 96 countries.
The response variable is 2004 Energy Use.
a) Explain the meaning of the 95% prediction interval in this context.
b) Explain the meaning of the 95% confidence interval in this context.
Fantastic news! We've Found the answer you've been seeking!
Step by Step Answer:

Answered By
Moses mwangi
With prior writing experience, be sure that I will give a great grade, If not an A+, it will be something close to this. My reviews speaks it all, Try me!!
78+ Reviews
157+ Question Solved
Related Book For 

Business Statistics
ISBN: 9780321716095
2nd Edition
Authors: Norean D. Sharpe, Paul F. Velleman, David Bock, Norean Radke Sharpe
Question Posted:
