

For the same regression as in Exercise 9, the Cooks Distances look like this: The analyst identified
Question:
For the same regression as in Exercise 9, the Cook’s Distances look like this: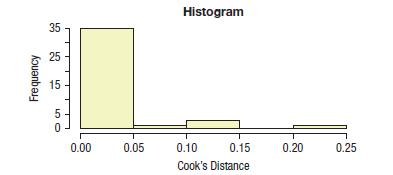
The analyst identified five people who had high leverage (1) or Cook’s Distance (4). Two of these people also had large studentized residuals. Indicator variables were created for these five points, and a regression was run with these new variables:
Variable Coefficient SE(Coeff) t-ratio P-value Intercept 30.6070 2.1890 13.9822 0.0000 Amount -0.1141 0.0105 -10.8995 0.0000 Teenagers -24.4799 3.0434 -8.0436 0.0000 Amount*
Teenagers 0.0969 0.0150 6.4550 0.0000 Person 4 -0.0974 1.3549 -0.0719 0.9431 Person 13 -2.4092 1.2320 -1.9556 0.0596 Person 24 -1.3280 1.1717 -1.1335 0.2657 Person 28 2.4430 1.2638 1.9331 0.0624 Person 36 -3.4489 1.1475 -3.0057 0.0052 The indicator variables show that of the five suspected high influence points, only Person 36 actually influences the regression.
Rerunning the regression without this point, we remove Person 36 and find the following:
R-squared = 0.8700, Adjusted R-squared: 0.8589 SE = 1.1849 with 39 observations Variable Coefficient SE(Coeff) t-ratio P-value Intercept 28.4034 2.0756 13.6843 0.0000 Amount -0.1033 0.0098 -10.4858 0.0000 Teenagers -23.5533 2.7463 -8.5765 0.0000 Amount*
Teenagers 0.0919 0.0134 6.8687 0.0000
a) What are the main differences between this model with Person 36 removed and the model from Exercise 7 with it included?
b) Which model do you prefer? Explain brief ly.
Step by Step Answer:


Business Statistics
ISBN: 9781292269313
4th Global Edition
Authors: Norean Sharpe, Richard De Veaux, Paul Velleman
