

From Exercise 1, we also have data on how long each person has been with the company
Question:
From Exercise 1, we also have data on how long each person has been with the company (tenure) categorized into three levels: less than 1 year, between 1 and 5 years, and more than 5 years. A table of the two variables together looks like:
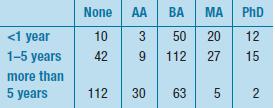
a) Find the marginal distribution of the tenure. (Hint: find the row totals.)
b) Verify that the marginal distribution of the education level is the same as that given in Exercise 1.
Fantastic news! We've Found the answer you've been seeking!
Step by Step Answer:

Answered By
Muhammad Ahtsham Shabbir
I am a professional freelance writer with more than 7 years’ experience in academic writing. I have a Bachelor`s Degree in Commerce and Master's Degree in Computer Science. I can provide my services in various subjects.
I have professional excellent skills in Microsoft ® Office packages such as Microsoft ® Word, Microsoft ® Excel, and Microsoft ® PowerPoint. Moreover, I have excellent research skills and outstanding analytical and critical thinking skills; a combination that I apply in every paper I handle.
I am conversant with the various citation styles, among them; APA, MLA, Chicago, Havard, and AMA. I also strive to deliver the best to my clients and in a timely manner.My work is always 100% original. I honestly understand the concern of plagiarism and its consequences. As such, I ensure that I check the assignment for any plagiarism before submission.
392+ Reviews
587+ Question Solved
Related Book For 

Business Statistics
ISBN: 9780321716095
2nd Edition
Authors: Norean D. Sharpe, Paul F. Velleman, David Bock, Norean Radke Sharpe
Question Posted:
