

Fuel economy. A bus company suffering losses for several months would like to find ways to make
Question:
Fuel economy. A bus company suffering losses for several months would like to find ways to make profits. In order to reduce fuel costs, the company hired a research firm to study the optimal speed for their buses to drive.
Researchers drove a bus for 200 miles at speeds ranging from 35 to 75 miles per hour. From their data, they created the model Fuel Efficiency = 30 - 0.13 Speed and created this residual plot: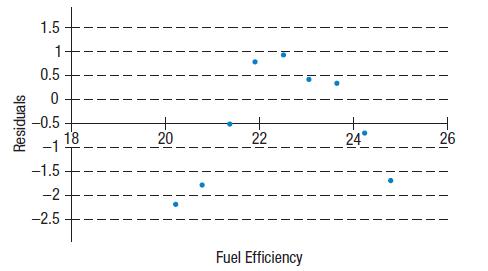
a) Interpret the slope of this line in context.
b) Explain why it’s silly to attach any meaning to the y-intercept.
c) When this model predicts high Fuel Efficiency, what can you say about those predictions?
d) What Fuel Efficiency does the model predict when the bus is driven at 45 mph?
e) What was the actual Fuel Efficiency when the bus was driven at 55 mph?
f) Do you think there appears to be a strong association between Speed and Fuel Efficiency? Explain.
g) Do you think this is the appropriate model for that association?
Explain.
Step by Step Answer:

This question has not been answered yet.
You can Ask your question!


Business Statistics
ISBN: 9781292269313
4th Global Edition
Authors: Norean Sharpe, Richard De Veaux, Paul Velleman
