

Here are the regression analysis and residual plot when we use the log of percentage change in
Question:
Here are the regression analysis and residual plot when we use the log of percentage change in the model. Is this a better model for percentage change? Explain. (Data in Residential Property)
Regression Statistics Multiple R 0.9737 R Square 0.9481 Adjusted R Square 0.9458 Standard Error 0.2144 Observations 24 Variable Coefficient SE(Coeff) t-ratio P-value Intercept 183.3078 9.0480 20.2595 0.0000 Month -0.0042 0.0002 -20.0505 0.0000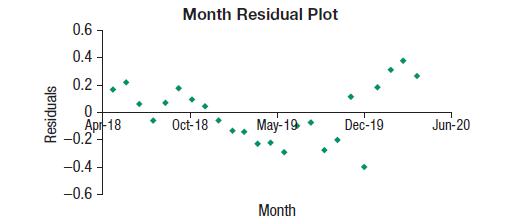
Step by Step Answer:

This question has not been answered yet.
You can Ask your question!
Related Book For 

Business Statistics
ISBN: 9781292269313
4th Global Edition
Authors: Norean Sharpe, Richard De Veaux, Paul Velleman
Question Posted:
