

Lobster industry 2008, catch model. In Chapter 17, we saw data on the lobster fishing industry in
Question:
Lobster industry 2008, catch model. In Chapter 17, we saw data on the lobster fishing industry in Maine. We have annual data from 1950 through 2005. The annual catch
(metric tons) has increased, but is this due to more licensed lobster fishers or to more efficient fishing? Because both fishers and traps are individually licensed, we have detailed data. Here’s a scatterplot of Catch/Fisher (tonnes) vs. the number of Traps (in millions).
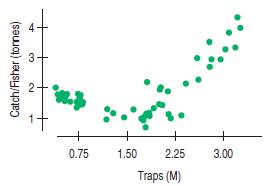
a) Consider the assumptions and conditions for regression.
Would re-expressing either variable help? Explain.
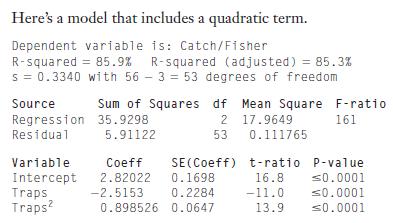
b) In 2001, almost 3 million lobster traps were licensed in Maine to 7327 fishers. What would this model estimate as the total catch for that year?
c) The coefficient of Traps in this model is negative, but we can see from the scatterplot that the catch has increased substantially as the number of traps increased. What accounts for this apparent anomaly?
Step by Step Answer:


Business Statistics
ISBN: 9780321716095
2nd Edition
Authors: Norean D. Sharpe, Paul F. Velleman, David Bock, Norean Radke Sharpe
