

Lobster industry 2008, value diagnosed. In Chapter 18, Exercise 34 (Lobster industry 2008), we constructed the following
Question:
Lobster industry 2008, value diagnosed. In Chapter 18, Exercise 34 (Lobster industry 2008), we constructed the following regression model to predict the log10 of the annual value of Maine’s lobster harvest.
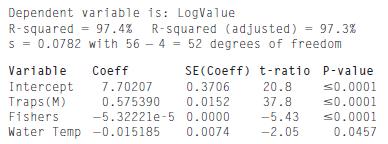
At that time we also examined plots of the residuals which appeared to satisfy the assumptions and conditions for regression inference. Let’s look a bit deeper. Here are histograms of the Cook’s Distances and Studentized residuals for this model.
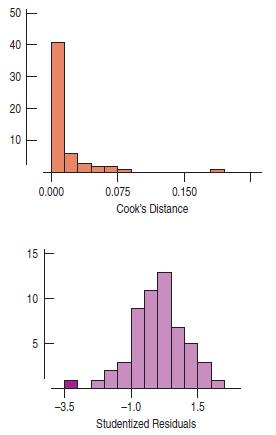
The case with high Cook’s Distance is 1994. (You can find a scatterplot of the logValue over time in Exercise 53 of Chapter 17.) What does this suggest about this model?
What would you recommend?
Step by Step Answer:


Business Statistics
ISBN: 9780321716095
2nd Edition
Authors: Norean D. Sharpe, Paul F. Velleman, David Bock, Norean Radke Sharpe
