

Oakland passengers. Much attention has been paid to the challenges faced by the airline industry. Patterns in
Question:
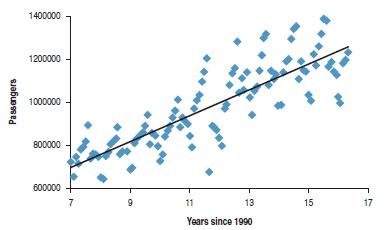
Oakland passengers. Much attention has been paid to the challenges faced by the airline industry. Patterns in customer demand are an important variable to watch. The scatterplot below, created in Excel, shows the number of passengers departing from Oakland (CA) airport month by month since the start of 1997. Time is shown as years since 1990, with fractional years used to represent each month.
(Thus, June of 1997 is 7.5—halfway through the 7th year after 1990.) www.oaklandairport.com
Here’s a regression and the residuals, created in Excel, plotted against Years since 1990:
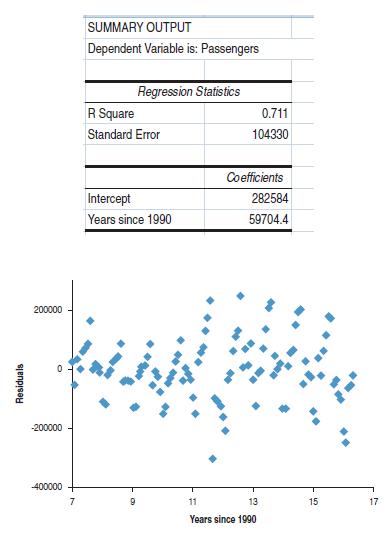
a) Interpret the slope and intercept of the regression model.
b) What does the value of say about how successful the model is?
c) Interpret in this context.
d) Compute the Durbin-Watson statistic and comment.
e) Would you use this model to predict the numbers of passengers in 2010 (YearsSince1990 20)? Explain.
f) There’s a point near the middle of this time span with a large negative residual. Can you explain this outlier?
Step by Step Answer:


Business Statistics
ISBN: 9780321716095
2nd Edition
Authors: Norean D. Sharpe, Paul F. Velleman, David Bock, Norean Radke Sharpe
