

Palm oil, part 3. Here is the partial summary output for the regression analysis and residuals plot
Question:
Palm oil, part 3.
Here is the partial summary output for the regression analysis and residuals plot for crude palm oil price vs. coconut oil price.
Regression Statistics Multiple R 0.8208 R Square 0.6737 Adjusted R Square 0.6589 Standard Error 37.8225 Observations 24 Variable Coefficient SE(Coeff) t-ratio P-value Intercept 392.7817 34.5923 11.3546 0.0000 Coconut oil Price 0.2627 0.0390 6.7394 0.0000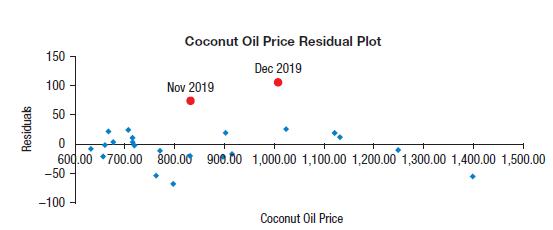
a) The residual plot shows 2 outliers, which are labeled according to the month of the year they correspond to.
Explain what the outliers say about the data for those months.
b) Even the Month is not plotted here, you have enough information from the previously shown displays of these data (Exercise 40) to tell where the earliest points are on the residual plot. Explain.
Step by Step Answer:

This question has not been answered yet.
You can Ask your question!


Business Statistics
ISBN: 9781292269313
4th Global Edition
Authors: Norean Sharpe, Richard De Veaux, Paul Velleman
