

Stock performance. The following table displays information for 40 widely held U.S. stocks, on how their oneday
Question:
Stock performance. The following table displays information for 40 widely held U.S. stocks, on how their oneday change on March 15, 2007 compared with their previous 52-week change.
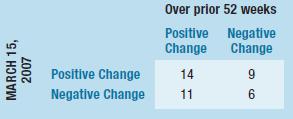
a) What percent of the companies reported a positive change in their stock price over the prior 52 weeks?
b) What percent of the companies reported a positive change in their stock price over both time periods?
c) What percent of the companies reported a negative change in their stock price over both time periods?
d) What percent of the companies reported a positive change in their stock price over one period and then a negative change in the other period?
e) Among those companies reporting a positive change in their stock price over the prior day what percentage also reported a positive change over the prior year?
f) Among those companies reporting a negative change in their stock price over the prior day what percentage also reported a positive change over the prior year?
g) What relationship, if any, do you see between the performance of a stock on a single day and its 52-week performance?
Step by Step Answer:


Business Statistics
ISBN: 9780321716095
2nd Edition
Authors: Norean D. Sharpe, Paul F. Velleman, David Bock, Norean Radke Sharpe
