

The following is the scatterplot of the variables in Exercise 7 with regression lines added for each
Question:
The following is the scatterplot of the variables in Exercise 7 with regression lines added for each group: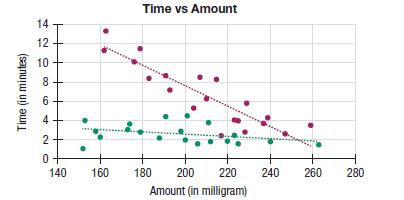
The regression model is:
R-squared = 0.8398, Adjusted R-squared: 0.8265 SE = 1.3056 with 40 observations Variable Coefficient SE(Coeff) t-ratio P-value Intercept 28.6197 2.2856 12.5218 0.0000 Amount -0.1052 0.0108 -9.7115 0.0000 Teenagers -23.7696 3.0249 -7.8580 0.0000 Amount*
Teenagers 0.0938 0.0147 6.3694 0.0000
a) Write out the regression model.
b) In this regression, the variable Amount*Teenagers is an interaction term. How would you interpret its coefficient?
c) What null hypothesis can we test with the t-ratio for Amount*Teenagers?
d) Would you reject that hypothesis at 0.05? What do you conclude?
Step by Step Answer:


Business Statistics
ISBN: 9781292269313
4th Global Edition
Authors: Norean Sharpe, Richard De Veaux, Paul Velleman
