

Toyota stock prices. The following time series graph shows daily closing stock prices (adjusted for splits and
Question:
Toyota stock prices. The following time series graph shows daily closing stock prices (adjusted for splits and dividends)
for Toyota Motor Manufacturing from April 1, 2008, through July 3, 2008 (Source: Yahoo! Finance).
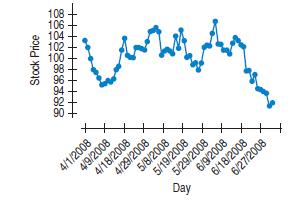
a) Which time series components seem to be present?
The method of moving averages was applied to these data.
Here are time series graphs showing moving average results using two different lengths.
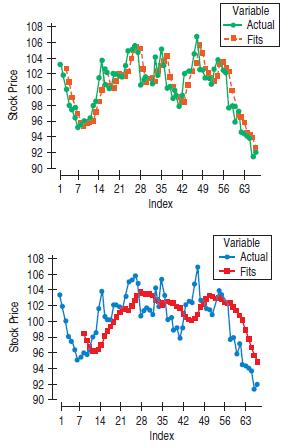
b) In which application is a larger length used?
Step by Step Answer:

This question has not been answered yet.
You can Ask your question!
Related Book For 

Business Statistics
ISBN: 9780321716095
2nd Edition
Authors: Norean D. Sharpe, Paul F. Velleman, David Bock, Norean Radke Sharpe
Question Posted:
