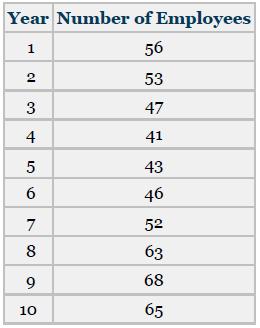
Visualize the following time-series data. Year Number of Employees 1 56 53 47 41 43 46 2
Question:
Visualize the following time-series data.

Transcribed Image Text:
Year Number of Employees 1 56 53 47 41 43 46 2 3 4 56 6 78 7 8 9 10 52 63 68 65
Fantastic news! We've Found the answer you've been seeking!
Step by Step Answer:
Answer rating: 100% (3 reviews)
70 65 Number of Empl...View the full answer

Answered By

Niala Orodi
I am a competent and an experienced writer with impeccable research and analytical skills. I am capable of producing quality content promptly. My core specialty includes health and medical sciences, but I can competently handle a vast majority of disciplines.
5.00+
1+ Reviews
10+ Question Solved
Related Book For 

Business Statistics For Contemporary Decision Making
ISBN: 9781119607458
10th Edition
Authors: Ken Black
Question Posted:
Students also viewed these Business questions
-
The following time series plot is based on data from the article Bubble Talk Expands: Corporate Debt Is Latest Concern Turning Heads(San Luis Obispo Tribune, September 13, 2002). It shows how...
-
Consider the following time series data representing quarterly sales of dishwashers at Big Boys Appliances over the past two years: The scatter plot of the data above shows seasonality with trend....
-
Using the following time series data of U.S. new car sales ($ millions), respondto the following items. Find Monthly Retail Trade Report, then select Time Series/Trend Charts to find the data for...
-
Which statement does NOT reflect a way that journals require authors to disclose potential or actual conflicts of interest? Group of answer choices Require researcher's Federal tax statements Require...
-
Steel bars of length 11 meters arrive at a company from its supplier. The bars must be cut into smaller lengths to meet weekly demand and minimize wastage. For each bar the company must decide: (i)...
-
What is the maximum allowable taxable income for filing a 1040A or 1040EZ income tax form?
-
Fill in the following table for each of your companies. Stock P/E P/B P/S PEG Profit margin Return on divided by equity divided by P/S P/B
-
What social and/or cultural factors played a role in this consumer purchasing the smartphone and data plan? Which ones do you think were most important and why?
-
Describe the items that would be included under each of the following headings and explain why you believe profit may not be the best indicator of an organizations liquidity. a) Cash flows from...
-
The U.S. Department of the Interior releases figures on mineral production. Following are the 15 leading states in nonfuel mineral production in the United States for 2016. a. Calculate the mean and...
-
How do various currencies around the world stack up to the U.S. dollar? Shown below is a bar chart of the value of the currency of various countries in U.S. dollars as of November 2018. The...
-
The general process of designing a suitable computer program to solve a given problem is known as the ____________.
-
Time (s) Velocity (cm/s or m/s) Uncertainty 0.100 -145 cm/s or 0.145 m/s +/- 0.089 m/s 0.200 -266 cm/s or 0.266 m/s +/- 0.010 m/s 0.300 -359 cm/s or 0.359 m/s +/- 0.0201 m/s 0.400 -451 cm/s or 0.451...
-
Using Technology to Generate Normal Quantile Plots. In Exercises 13-16, use the data from the indicated exercise in this section. Use software (such as Statdisk, Minitab, Excel, or StatCrunch) or a...
-
Use your understanding of work and power to answer the following questions. 1. Two physics students, Will N. Andable and Ben Pumpiniron, are in the weightlifting room. Will lifts the 100-pound...
-
Problem 2. Consider the following chemical reaction. 2H2 + O2 = 2HO Gibbs Duhem equation states that SdT - Vdp+ Nidi=0. Apply this equation for the above reaction and determine the equilibrium...
-
Part D: Exploring Pascal's Triangle 1. Fill-In the missing numbers in Pascal's Triangle. See 2. Find the sum of each row in Pascal's Triangle. Describe the pattern. 1, 2, 4, 8, 16... Power of 2n 1 1...
-
Assuming our Galaxy represents a good average for all other galaxies, how many stars are in the observable universe?
-
In Problem use absolute value on a graphing calculator to find the area between the curve and the x axis over the given interval. Find answers to two decimal places. y = x 3 ln x; 0.1 x 3.1
-
Study the following dot plot and comment on the general shape of the distribution. Discuss any gaps or heavy concentrations in thedata. 088 8 18 27 36 45 54 63
-
Shown here is an Excel-produced pie chart representing physician specialties. What does the chart tell you about the various specialties? Physician Specialties Psychiatry Anesthesiology Family...
-
Suppose 100 CPA firms are surveyed to determine how many audits they perform over a certain time. The data are summarized using the Minitab stem-and-leaf plot shown in the next column. What can you...
-
Domino is 4 0 years old and is married out of community of property with the exclusion of the accrual system to Dolly ( 3 5 ) . They have one child, Domonique, who is 1 1 years old. Domino resigned...
-
YOU ARE CREATING AN INVESTMENT POLICY STATEMENT FOR JANE DOE General: 60 years old, 3 grown children that are living on their own and supporting themselves. She is in a very low tax rate so we don't...
-
firm purchased a new piece of equipment with an estimated useful life of eight years. The cost of the equipment was $65,000. The salvage value was estimated to be $10,000 at the end of year 8. Using...

Study smarter with the SolutionInn App


