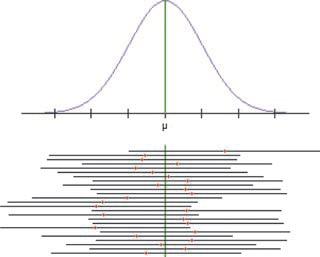
How confident? The figure below shows the result of taking 25 SRSs from a Normal population and
Question:
How confident? The figure below shows the result of taking 25 SRSs from a Normal population and constructing a confidence interval for each sample.
Which confidence level—80%, 90%, 95%, or 99%—
do you think was used? Explain.

Fantastic news! We've Found the answer you've been seeking!
Step by Step Answer:
Related Book For 

Question Posted:


