

If the distribution of absences was displayed in a histogram, what would be the best description of
Question:
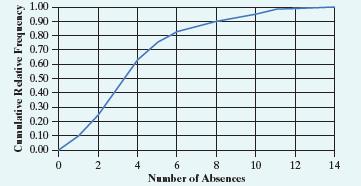
If the distribution of absences was displayed in a histogram, what would be the best description of the histogram’s shape?
(a) Symmetric
(b) Uniform
(c) Skewed left
(d) Skewed right
(e) Cannot be determined The number of absences during the fall semester was recorded for each student in a large elementary school. The distribution of absences is displayed in the following cumulative relative frequency graph..
Step by Step Answer:

This question has not been answered yet.
You can Ask your question!
Related Book For 
Question Posted:
