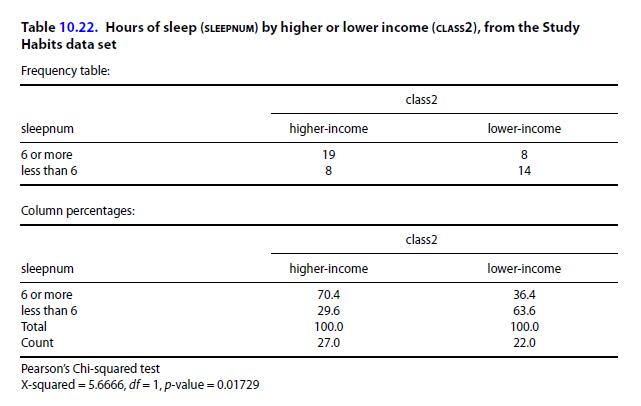
Look at the following table and discuss what we have found. Return to the first table in
Question:
Look at the following table and discuss what we have found.

Return to the first table in the chapter (Table 10.1), the one about race and sleep, and compare it to the one shown above about class and sleep. Answer the following questions, thinking about how you would explain results:
a) Did the researchers find a significant difference in the sleep of upper- and lower-income students, and how do you know?
b) What percent of students in the upper-income category report getting six or more hours sleep?
c) How do we know from Table 10.1 that race3 is a significant predictor of whether a person got six hours of sleep or less than that? Explain.
d) I find these results about sleep and race and sleep and class a bit surprising. Can you suggest a new variable that might help us to understand this finding – a variable we might want to add to a new version of the survey?
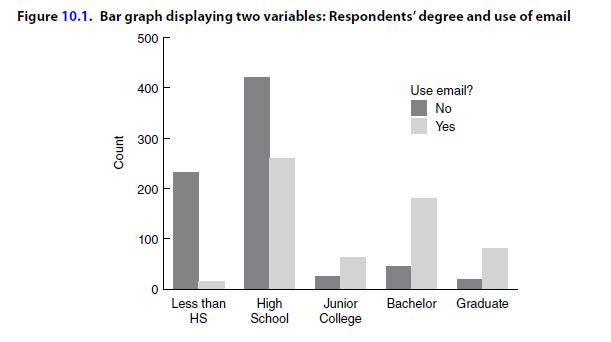
Figure 10.1:-

Step by Step Answer:

The Joy Of Stats A Short Guide To Introductory Statistics In The Social Sciences
ISBN: 9781487527297
3rd Edition
Authors: Roberta Garner, Michael Ash


