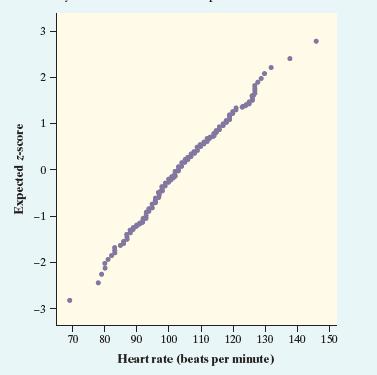
Runners heart rates The figure below is a Normal probability plot of the heart rates of 200
Question:
Runners’ heart rates The figure below is a Normal probability plot of the heart rates of 200 male runners after six minutes of exercise on a treadmill.13 The distribution is close to Normal. How can you see this? Describe the nature of the small deviations from Normality that are visible in the plot.

Step by Step Answer:
Related Book For 

Question Posted:


