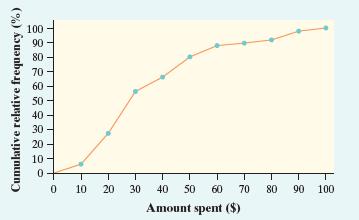
Shopping spree The figure below is a cumulative relative frequency graph of the amount spent by 50
Question:
Shopping spree The figure below is a cumulative relative frequency graph of the amount spent by 50 consecutive grocery shoppers at a store.

(a) Estimate the interquartile range of this distribution.
Show your method.
(b) What is the percentile for the shopper who spent $19.50?
(c) Draw the histogram that corresponds to this graph.
Step by Step Answer:
Related Book For 

Question Posted:


