Stats teachers cars A random sample of AP Statistics teachers was asked to report the age (in
Question:
Stats teachers’ cars A random sample of AP® Statistics teachers was asked to report the age (in years)
and mileage of their primary vehicles. A scatterplot of the data, a least-squares regression printout, and a residual plot are provided below.
Predictor Coef SE Coef T P Constant 3704 8268 0.45 0.662 Age 12188 1492 8.17 0.000 S = 20870.5 R-Sq = 83.7% R-Sq(adj) = 82.4%
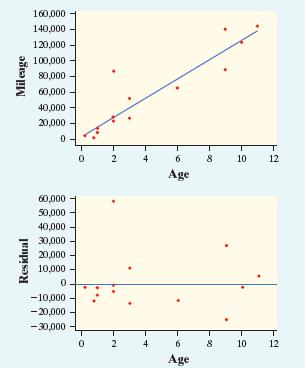
(a) Give the equation of the least-squares regression line for these data. Identify any variables you use.
(b) One teacher reported that her 6-year-old car had 65,000 miles on it. Find and interpret its residual.
(c) What’s the correlation between car age and mileage?
Interpret this value in context.
(d) Is a linear model appropriate for these data? Explain how you know.
(e) Interpret the values of s and r2.
Step by Step Answer:

This question has not been answered yet.
You can Ask your question!