Question:
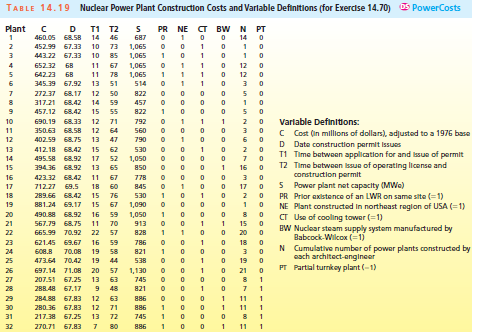
Although natural gas is currently inexpensive and nuclear power currently (and perhaps deservedly) does not have a good reputation, it is possible that more nuclear power plants will be constructed in the future. Table 14.19 presents data concerning the construction costs of light water reactor (LWR) nuclear power plants. The dependent variable C, construction cost, is expressed in millions of dollars, adjusted to a 1976 base. This dependent variable and 10 potential predictor variables are summarized in Table 14.19. Preliminary analysis of the data and economic theory indicate that variation in cost increases as cost increases. This suggests transforming cost by taking its natural logarithm. (1) Build a multiple regression model to predict in C by using all possible regressions and stepwise regression. (2) Use residual analysis to check your model. (3) State which variables are important in predicting the cost of constructing an LWR plant, and (4) State a prediction equation that can be used to predict ln C.

Transcribed Image Text:
Nudlear Power Plant Construction Costs and Varlable Definitions (for Exercdse 14.70) OS PowerCosts TABLE 14.19 PR NE CT BW N D T1 T2 Plant PT 1 0 0 14 0 460.05 68.58 14 46 687 452.99 67.33 10 73 1,065 1,065 443.22 67.33 10 85 O 12 0 12 0 652.32 68 11 67 1,065 1,065 642.23 68 11 78 345.39 67.92 13 51 514 27237 68.17 12 50 822 317.21 68.42 14 59 457 457.12 68.42 15 55 822 12 71 Varlable Definitions: 10 690.19 68.33 792 C Cost (in millions of dollars), adjustod to a 1976 base D Date construction permit Issues T1 Time batwoen application for and issue of permit T2 Time batwoen Issue of operating Ilicense and construction parmit 5 Power plant net capacity (MWe) PR Prior axistence of an LWR on same sita (=1) NE Plant constructod in northeast raglon of USA (=1) CT Use of cooling towar (-1) BW Nuclear steam supply system manufactured by Babcock-Wilcox (=1) 11 350.63 68.58 12 64 560 12 402.59 68.75 13 47 790 13 412.18 68.42 15 62 530 495.58 68.92 17 52 14 1,050 15 394.36 68.92 13 65 850 16 423.32 68.42 11 67 16 778 17 712.27 69.5 18 60 845 17 18 289.66 68.42 15 76 530 67 19 881.24 69.17 15 1,090 20 490.88 68.92 16 59 1,050 21 567.79 68.75 11 70 913 15 0 22 665.99 70.92 22 57 828 20 0 23 621.45 69.67 16 59 786 18 N Cumulative number of powar plants constructed by each architect-engineer PT Partial turrkey plant (-1) 821 538 24 608.8 70.08 19 58 25 473.64 70.42 19 44 19 0 26 697.14 71.08 20 57 1,130 21 27 207.51 67.25 13 63 745 9 48 28 288.48 67.17 821 11 1 11 1 29 284.88 67.83 12 63 886 20 280.36 67.83 12 71 886 31 217.38 67.25 13 72 745 7 80 1 11 1 32 270.71 67.83 886


