All Matches
Solution Library
Expert Answer
Textbooks
Search Textbook questions, tutors and Books
Oops, something went wrong!
Change your search query and then try again
Toggle navigation
FREE Trial
S
Books
FREE
Tutors
Study Help
Expert Questions
Accounting
General Management
Mathematics
Finance
Organizational Behaviour
Law
Physics
Operating System
Management Leadership
Sociology
Programming
Marketing
Database
Computer Network
Economics
Textbooks Solutions
Accounting
Managerial Accounting
Management Leadership
Cost Accounting
Statistics
Business Law
Corporate Finance
Finance
Economics
Auditing
Hire a Tutor
AI Study Help
New
Search
Search
Sign In
Register
study help
mathematics
business statistics
Questions and Answers of
Business Statistics
A team of medical researchers carried out an experiment on adult patients diagnosed with chronic fatigue syndrome. Patients were randomly assigned to a drug treatment condition or to a placebo
In Exercise 17, find the average number of plays it will take to score a touchdown. Ignore the four-downs rule and keep playing until a touchdown is scored.In Exercise 17A football is placed on the
Two players play rock, paper, scissors. The rules are as follows: Since paper covers rock, paper wins. Since rock breaks scissors, rock wins. Since scissors cut paper, scissors win. Each person
An airline overbooks 15% of the time.
A baseball player strikes out 40% of the time.
When answering questions in a survey, do you prefer open-ended questions or closed-ended questions?
Do you think all automobiles should have heavy-duty bumpers, even though it will raise the price of the cars by $500?
Almost 16% of Texas residents are foreign-born. Explain how to select a sample of 40 based on this scenario.
Three players play odd man out. (Three coins are tossed; if all three match, the game is repeated and no one wins. If two players match, the third person wins all three coins.)
Two players match pennies.
Who is responsible for the development of modern simulation techniques?
Define simulation techniques.
Do you feel that playing football causes too many concussions?
Are you in favor of repeated tours of duty for our military in war zones?
Do you feel that health care copays are too high?
Why is it not good to not text while driving?
What is your opinion of Thomas Jefferson owning slaves?
Four years ago there was a teachers’ strike. Do you feel that the issues have been resolved?
What is your income?
Do you regularly use alcohol?
What do you dislike about Presidential debates?
How many members are in your family?
If a plane were to crash on the border of New York and New Jersey, where should the survivors be buried?
Which artificial sweetener do you prefer?
How long have you studied for this examination?
Do you approve of the mayor’s political agenda?
Do you like the mayor?
Which type of artificial sweetener do you think is the least unhealthy?
Give an example of how volunteer bias might occur.
Define volunteer bias.
Give an example of how response bias might occur.
Define response or interview bias.
Give an example of how nonresponsive bias might occur.
Define nonresponsive bias.
Give an example of how sampling or selection bias might occur.
Define sampling or selection bias.
Divide the 50 states into five subgroups by geographic location, using a map of the United States. Each subgroup should include 10 states. The subgroups should be northeast, southeast, central,
Why are samples used in statistics?
Name the four basic sampling techniques.
1. Open Microsoft Power BI and click on Open Other Reports. Locate the file New York City Taxi.PBIX in the same web location as other files used in this text.2. Assume you are working for an agency
Referring to Exercises 18-13 through 18-17, create a new column called Sales Margin in the SalesData table that is the difference between ListPrice and UnitPrice. Note that ListPrice is found in the
Referring to Exercise 18-16, develop a table that shows average Standard Cost, maximum and minimum Standard Cost, and standard deviation for Standard Cost.
Referring to the Bordon’s Plumbing Supply application, change the format for the Standard Cost variable in the ProductData table to one showing the values in dollars and cents. Then develop a
Referring to Exercises 18-13 and 18-14, use Power BI to construct a horizontal bar chart that shows the total number of units ordered by territory group. Add labels to the bars.
Referring to Exercise 18-13, open a blank canvas and create a “card” that shows the number of sales transactions last month.
Refer to the Bordon’s Plumbing Supply application in this section, open Microsoft Power BI Desktop, and use Get Data to open three files: Bordon’s SalesData, Bordon’s Territories, and
Referring to Exercises 18-10 and 18-11, calculate the mean percentage of female board members for Delaware-incorporated companies that have ten or more board members, that are traded on the NYSE with
Referring to Exercise 18-10, calculate the mean number of board members for Delaware-incorporated companies that are traded on the NYSE and that have revenues of $20 billion or higher and have
Referring to Exercises 18-6 through 18-9, of those NYSE companies that have revenues of $20 billion or higher and that are incorporated in Delaware, calculate the mean and standard deviation of
Referring to Exercises 18-6 through 18-8, determine the number of companies traded on the NYSE that have revenues higher than $20 billion by state of incorporation. Prepare a graph to display these
Referring to Exercises 18-6 and 18-7, determine the number of companies traded on the New York Stock Exchange (NYSE) that have revenues of $20 billion or higher.
Referring to Exercise 18-6, calculate the mean revenue broken down by the stock exchange where the firm’s shares are traded. Display the results in graphical form.
Use Excel to determine the number of companies and the mean revenue for the companies listed in the data file Public Companies.
Based on your own independent research, discuss one or more examples of successful business analytics applications. Be sure to indicate how business analytics was used to improve decision making
What is meant by the terms descriptive analytics and predictive analytics? Under what conditions might each be used?
Locate an example of a dashboard and describe what it shows. Then discuss how a manager might use it.
What is the purpose of a dashboard in business analytics?
Using the material presented in this chapter and other sources of information, discuss the difference between business intelligence and business analytics.
In the library, find two journal articles that use one of the nonparametric tests discussed in this chapter. Prepare a brief outline of the articles, paying particular attention to the reasons given
Find an organization you think would be interested in data that violate the measurement scale or known distribution assumptions necessary to use the statistical tools found in Chapters 10–12
The file Quarterly Shipments lists the number of units shipped each quarter for the years 2011–2015 by Bourff Manufacturing.a. Produce a time-series graph of the data. Are there noticeable trend
The file Phone Expenses contains the monthly telephone expenses for a small business.a. Produce a time-series graph of the data. Can you identify a trend or seasonal component?b. Using the Excel 2016
Freddie Mac is an organization that was formed by the U.S. Congress in 1970 to help maintain mortgage interest rates at a fairly stable level. The data in the file Mortgage Rates show the 30-year
A pizza outlet has tracked the total number of super deluxe pizzas sold in each of the past six years. The data are as follows:a. Produce a time-series plot of these data. Indicate the time-series
Identify the businesses in your community that you expect to have sales that exhibit a seasonal component. Discuss.
Go to the library or use the Internet to find data showing your state’s population for the past 20 years. Plot these data and indicate which of the time-series components are present.
The file Museum Visitors contains the number of visitors to a city museum each day during the period January 3 to March 20, 2015.a. Use the data and the Excel 2016 Forecast Sheet option to develop a
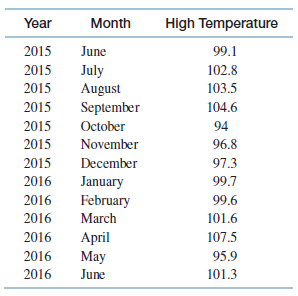
An electrical utility in a city in a South American country needs to forecast the highest temperature in the city on any day during a month. The following data reflect the highest recorded
A May 2015 Wall Street Journal article indicated that 2015 college graduates had the highest average student debt ever, at slightly more than $35,000 per student. The following data show the average
Refer to the sales data for the years 2013 through 2016 shown in Exercise 16-20 and provide a seasonally adjusted forecast using the linear trend model for each quarter of the year 2017. Also use the
Using the multiplicative model, estimate the T × C portion by computing a 12-month moving average and then the centered 12-month moving average.
What does it mean if we have developed a multiple regression model and ave concluded that the model is apt?
Go to the library or use the Internet to find three articles that make use of a regression model with more than one independent variable. For each article, write a short summary covering the
Go to the library and locate an article in a journal related to your major (Journal of Marketing, Journal of Finance, etc.) that uses linear regression. Discuss the following:a. How the author chose
1. Calculate the total purchase cost for each supplier.2. Calculate the warranty replacement cost for Altman Electronics, and calculate the total cost if Altman is selected.3. Calculate the total
In a business publication such as The Wall Street Journal or Bloomberg Businessweek, find a graph or chart representing cross-sectional data. Discuss how the data were gathered and the purpose of the
In a business publication such as The Wall Street Journal or Bloomberg Businessweek, find a graph or chart representing time-series data. Discuss how the data were gathered and the purpose of the
Based on The College Board’s Annual Survey of Colleges in 2014–2015, the average tuition increase was 3.7% at private colleges and 2.9% at public universities (trends.collegeboard.org). Are these
In your capacity as assistant sales manager for a large office products retailer, you have been assigned the task of interviewing purchasing managers for medium and large companies in the San
Locate a business periodical such as Fortune or Forbes or a business newspaper such as The Wall Street Journal. Find three examples of the use of a graph to display data. For each graph,a. Give the
Explain the difference between the between-treatment variability and the within-treatment variability when performing a one-way ANOVA.
Set up probability revision tables to:a. Find the probability that the “economist says up” and find the posterior probabilities of market up, market flat, and market down given that the
Use the following Minitab output to find rs, and then test H0: ρs = 0 versus Ha: ρs > 0 for the service time data below.
Use the Kruskal–Wallis H test to compare golf ball brands Alpha, Best, Century, and Divot using the data in Table 17.11. Use α = .01 and the Excel add-in (MegaStat) output on the right side of
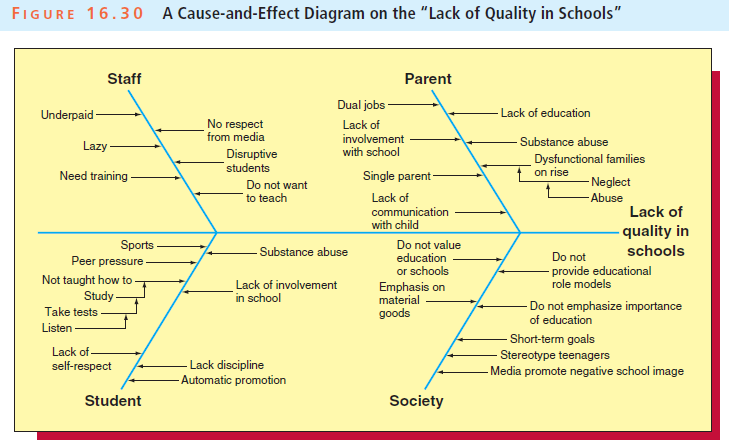
In an issue of Quality Progress, Franklin P. Schargel presents a cause-and-effect diagram for the “lack of quality in schools.” We present this diagram in Figure 16.30.a. Identify and circle the
Figure 15.14 gives the Minitab output of using simple exponential smoothing to forecast yearly U.S. lumber production. Here Minitab has estimated the smoothing constant alpha to be .0361553. Use the
Consider Table 15.13 (page 700). Verify (calculate) that S3, an estimate made in period 3 of β0, is 359.276. Also verify (calculate) that the one-period-ahead forecast error for period 4 is -62.276,
What is the equation of the estimated trend that has been calculated using the deseasonalized data?International Machinery, Inc., produces a tractor and wishes to use quarterly tractor sales data
What type of trend is indicated by the plot of the deseasonalized data?International Machinery, Inc., produces a tractor and wishes to use quarterly tractor sales data observed in the last four years
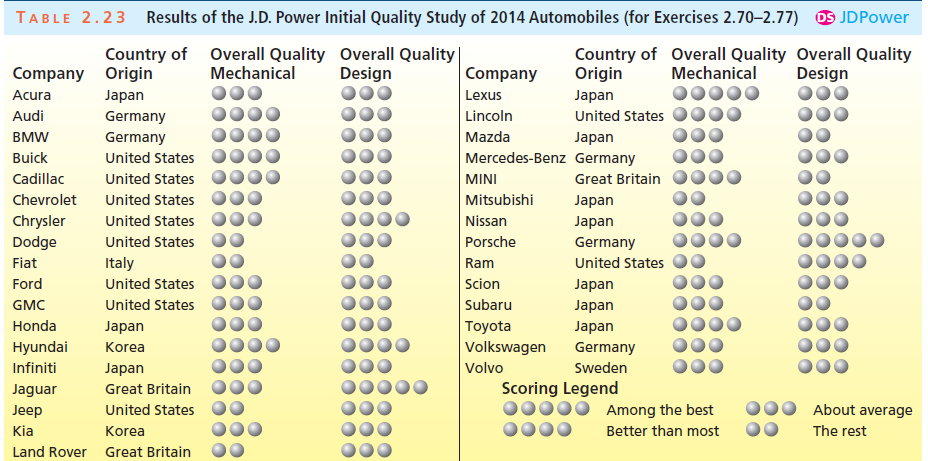
Develop a table of row percentages for the contingency table you set up in Exercise 2.74. Using these row percentages, construct a percentage frequency distribution of overall mechanical quality
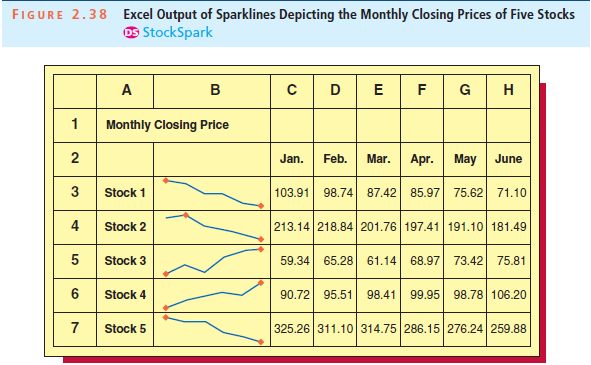
Suppose that the closing prices at the end of July for the five stocks in Figure 2.38 were, respectively, 65.20, 174.88, 78.25, 110.44 and 248.67. Use Excel (see the Excel appendix) to construct
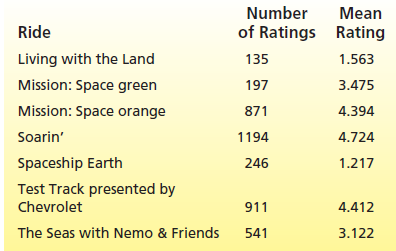
Suppose on the day that the numbers of ratings and mean ratings for the seven Epcot rides in Figure 2.37(a) were obtained, data drill down shows that the numbers of ratings and the mean ratings given
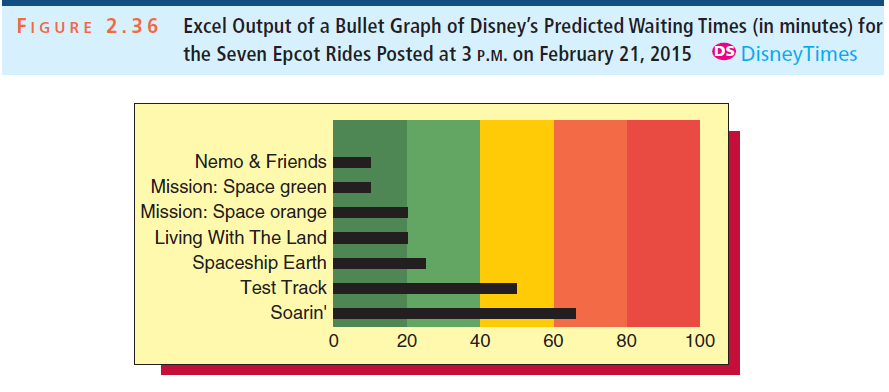
At 5 p.m. on February 21, 2015, the waiting times posted at Epcot for Nemo & Friends, Mission: Space green, Mission: Space orange, Living with the Land, Spaceship Earth, Test Track, and Soarin’
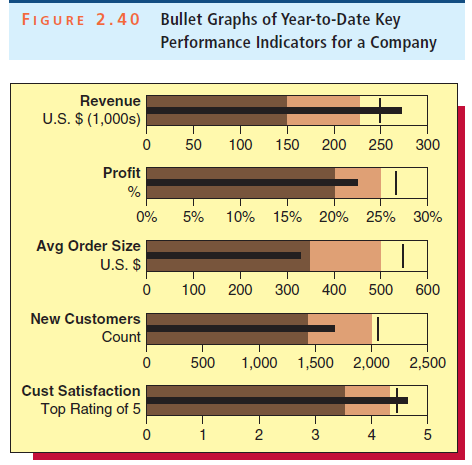
Interpret the bullet graphs in Figure 2.40.
The 18 cars in Exercise 14 had an average price of +19,843.50 (SD = 1853.592), and the correlation between Price and Mileage was –0.889. If the Mileage of a 2012 Honda Civic EX was one SD below the
Air Canada and United have for many years been members of the Star Alliance, selling seats on each other’s f lights while competing for passengers. In 2011 they proposed a closer collaboration
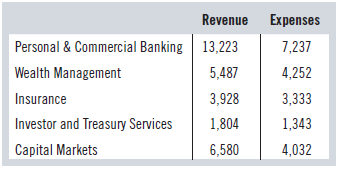
The Royal Bank of Canada (RBC) is the largest bank in Canada and employs about 79,000 full-time and part-time employees who serve 15 million customers in Canada, the United States, and 44 other
For the data in Exercise 2:a) How many degrees of freedom does the t-statistic have?b) How many degrees of freedom would the t-statistic have if the sample size had been 5?
Showing 1 - 100
of 4120
1
2
3
4
5
6
7
8
9
10
11
12
13
14
15
Last