

An electrical utility in a city in a South American country needs to forecast the highest temperature
Question:
An electrical utility in a city in a South American country needs to forecast the highest temperature in the city on any day during a month. The following data reflect the highest recorded temperature (in degrees Fahrenheit) on any day during each month between June 2015 and June 2016:
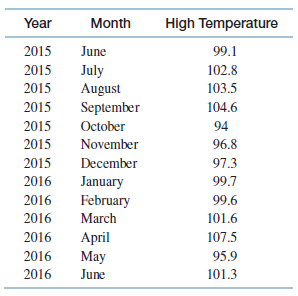
a. Construct a time-series plot of these data. Does it appear that a linear trend exists in the time series?
b. Calculate forecasts for each of the months in the time series. Use a smoothing constant of 0.25.
c. Calculate the MAD for the forecasts you generated in part b.
d. Construct a single exponential smoothing forecast for July 2016. Use a smoothing constant of 0.25.
Step by Step Answer:
a There does not appear to be any trend component in this t...View the full answer


Business Statistics A Decision Making Approach
ISBN: 9780134496498
10th Edition
Authors: David F. Groebner, Patrick W. Shannon, Phillip C. Fry
