New Semester
Started
Get
50% OFF
Study Help!
--h --m --s
Claim Now
Question Answers
Textbooks
Find textbooks, questions and answers
Oops, something went wrong!
Change your search query and then try again
S
Books
FREE
Study Help
Expert Questions
Accounting
General Management
Mathematics
Finance
Organizational Behaviour
Law
Physics
Operating System
Management Leadership
Sociology
Programming
Marketing
Database
Computer Network
Economics
Textbooks Solutions
Accounting
Managerial Accounting
Management Leadership
Cost Accounting
Statistics
Business Law
Corporate Finance
Finance
Economics
Auditing
Tutors
Online Tutors
Find a Tutor
Hire a Tutor
Become a Tutor
AI Tutor
AI Study Planner
NEW
Sell Books
Search
Search
Sign In
Register
study help
mathematics
business statistics
Business Analytics And Statistics 1st Edition Ken Black, John Asafu Adjaye, Paul Burke, Nelson Perera, Carl Sherwood, Saleh A. Wasimi - Solutions
Boxer A is favored to win over boxer B with odds 4:3. Simulate nine rounds between the two and declare a winner.
A sales representative finds that there is a 30% probability of making a sale by visiting the potential customer personally. For every 20 calls, find the probability of making three sales in a row.
Find a study that uses a questionnaire. Select any questions that you feel are improperly written.
A basketball player has a 60% success rate for shooting foul shots. If she gets two shots, find the probability that she will make one or both shots.
A field goal kicker is successful in 60% of his kicks inside the 35-yard line. Find the probability of kicking three field goals in a row.
Many research studies described in newspapers and magazines do not report the sample size or the sampling method used. Try to find a research article that gives this information; state the sampling method that was used and the sample size.
In Exercise 19, find the average number of shots fired.In Exercise 19Two shooters shoot clay pigeons. Gail has an 80% accuracy rate and Paul has a 60% accuracy rate. Paul shoots first. The first person who hits the target wins. Find the probability that each wins.
Four dice are rolled 50 times. Find the average of the sum of the number of spots that will appear.
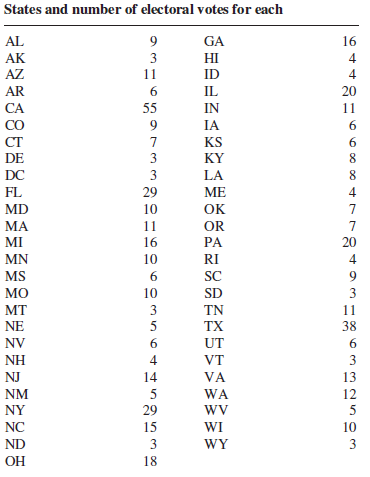
Select a cluster of 10 states, and compute the mean number of electoral votes for the sample. Compare this mean with the population mean. States and number of electoral votes for each AL GA 16 AK 3 HI AZ 11 ID 4 AR IL 20 CA IN 55 11 CO IA 6. CT KS 6. 8. DE 3 KY DC 3 LA 8. FL 29 ME 4 MD 10 ок MA
Two shooters shoot clay pigeons. Gail has an 80% accuracy rate and Paul has a 60% accuracy rate. Paul shoots first. The first person who hits the target wins. Find the probability that each wins.
To win a certain lotto, a person must spell the word big. Sixty percent of the tickets contain the letter b, 30% contain the letter i, and 10% contain the letter g. Find the average number of tickets a person must buy to win the prize.
A football is placed on the 10-yard line, and a team has four downs to score a touchdown. The team can move the ball only 0 to 5 yards per play. Find the average number of times the team will score a touchdown.
Select a systematic sample of 10 states, and compute the mean number of electoral votes for the sample. Compare this mean with the population mean. States and number of electoral votes for each AL GA 16 AK 3 HI AZ 11 ID 4 AR IL 20 CA IN 55 11 CO IA 6. CT KS 6. 8. DE 3 KY DC 3 LA 8. FL 29 ME 4 MD
The probability that a door is locked is 0.6, and there are five keys, one of which will unlock the door. The experiment consists of choosing one key at random and seeing if you can unlock the door. Repeat the experiment 50 times and calculate the empirical probability of unlocking the door.
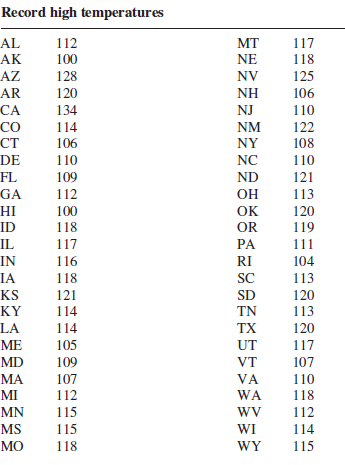
Choose a different method to select 10 states and compute the sample mean high temperature. Compare with your answer in Exercise 15 and with the population mean. Do you see any features of this data set that might affect the results of obtaining a sample mean? Record high temperatures AL 112 MT
A caramel corn company gives four different prizes, one in each box. They are placed in the boxes at random. Find the average number of boxes a person needs to buy to get all four prizes.
Which method of sampling might be good for this set of data? Choose one to select 10 states and calculate the sample mean. Compare with the population mean. Record high temperatures AL 112 MT 117 AK AZ AR CA CO CT DE FL GA 100 NE 118 NV NH 128 125 120 106 134 NJ 110 NM 114 122 106 NY 108 NC 110
A die is rolled until all faces appear at least once. Find the average number of tosses.
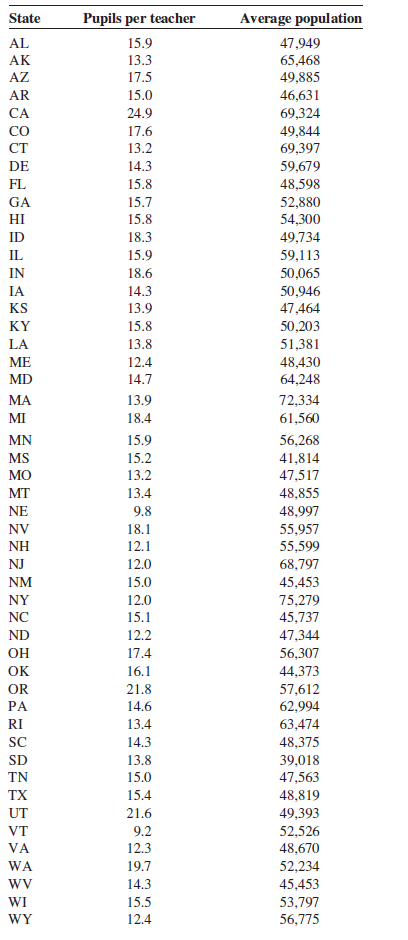
Are there any characteristics of these data that might create problems in sampling? Average population State Pupils per teacher AL 15.9 47,949 65,468 49,885 AK 13.3 AZ 17.5 AR 15.0 46,631 69,324 24.9 CA CO 17.6 49,844 13.2 69,397 59,679 48,598 52,880 54,300 49,734 CT DE 14.3 15.8 FL GA 15.7 HI
Select a cluster sample of 10 states, and find the mean of the average population and the mean of the pupils per teacher. How do your results compare with the U.S. figures? Average population State Pupils per teacher AL 15.9 47,949 65,468 49,885 AK 13.3 AZ 17.5 AR 15.0 46,631 69,324 24.9 CA CO
Select a systematic sample of 10 states, and find the mean of the average population and the mean of the pupils per teacher. How do your results compare with the U.S. figures? Average population State Pupils per teacher AL 15.9 47,949 65,468 49,885 AK 13.3 AZ 17.5 AR 15.0 46,631 69,324 24.9 CA CO
Using the table of random numbers, select 10 states and find the mean of the average population and the mean of the pupils per teacher. How do your results compare with the U.S. figures? Average population State Pupils per teacher AL 15.9 47,949 65,468 49,885 AK 13.3 AZ 17.5 AR 15.0 46,631 69,324
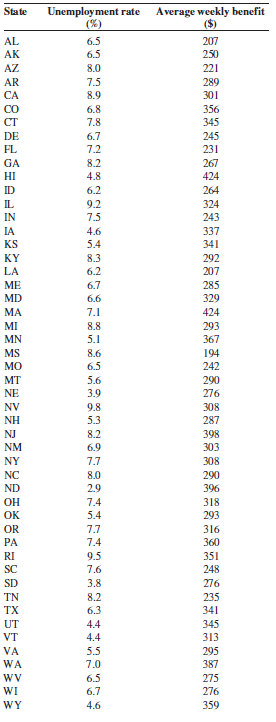
Select a cluster sample of 10 states, and find the mean of the unemployment rates and the mean of the average weekly benefits. How do your results compare with the U.S. figures? A verage weekly benefit ($) State Unemployment rate (%) AL 6.5 207 AK 6.5 250 AZ 8.0 221 AR 7.5 289 CA 8.9 301 CO 6.8
Find the mean of the unemployment rates and the mean of the average weekly benefits. How do your results compare with the U.S. figures? A verage weekly benefit ($) State Unemployment rate (%) AL 6.5 207 AK 6.5 250 AZ 8.0 221 AR 7.5 289 CA 8.9 301 CO 6.8 356 CT 7.8 345 245 DE 6.7 FL 7.2 231 GA 8.2
Select a systematic sample of 10 states, and find the mean of the unemployment rates and the mean of the average weekly benefits. How do your results compare with the U.S. figures? A verage weekly benefit ($) State Unemployment rate (%) AL 6.5 207 AK 6.5 250 AZ 8.0 221 AR 7.5 289 CA 8.9 301 CO 6.8
Select a random sample of 10 states, and find the mean of the unemployment rates and the mean of average weekly benefits. How do your results compare with the U.S. figures? A verage weekly benefit ($) State Unemployment rate (%) AL 6.5 207 AK 6.5 250 AZ 8.0 221 AR 7.5 289 CA 8.9 301 CO 6.8 356 CT
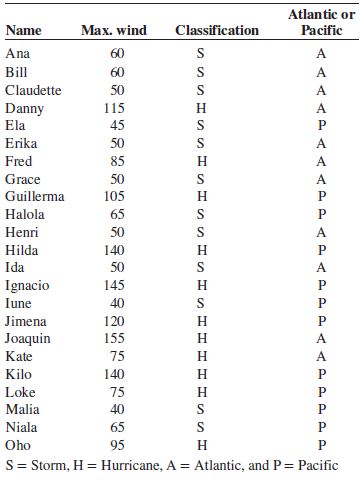
Divide the 23 storms into 4 subgroups (The fourth group will only have 5 storms.). Then select a sample of three storms from each group. Compute the means for wind speeds. Compare these means to the population mean. Atlantic or Classification Name Max. wind Pacific Ana 60 Bill 60 A Claudette 50 A
Select a cluster of 10 storms. Compute the sample means wind speeds. Compare these sample means with the population means. Atlantic or Classification Name Max. wind Pacific Ana 60 Bill 60 A Claudette 50 A Danny Ela 115 н 45 Erika 50 Fred 85 н Grace 50 105 Guillerma н Halola 65 Henri 50 A 140
Select a systematic sample of eight storms and calculate the average maximum wind speed. Compare with the population mean. Atlantic or Classification Name Max. wind Pacific Ana 60 Bill 60 A Claudette 50 A Danny Ela 115 н 45 Erika 50 Fred 85 н Grace 50 105 Guillerma н Halola 65 Henri 50 A 140
Give three examples of simulation techniques.
Select a random sample of eight storms by using random numbers, and find the average maximum wind speed. Compare with the population mean. Atlantic or Classification Name Max. wind Pacific Ana 60 Bill 60 A Claudette 50 A Danny Ela 115 н 45 Erika 50 Fred 85 н Grace 50 105 Guillerma н Halola 65
Toss a coin 30 times and record the outcomes (H or T). Test the results for randomness at α = 0.05. Repeat the experiment a few times and compare your results.
Select a three-digit state lottery number over a period of 50 days. Count the number of times each digit, 0 through 9, occurs. Test the claim, at α = 0.05, that the digits occur at random.
Give three examples of proportions.
Conduct a survey of the number of extracurricular activities your classmates are enrolled in. Construct a probability distribution and find the mean, variance, and standard deviation.
Roll two dice 100 times and find the mean, variance, and standard deviation of the sum of the dots. Compare the result with the theoretical results obtained in Exercise 20.In exerciseConstruct a probability distribution for the sum shown on the faces when two dice are rolled. Find the mean,
Select a newspaper or magazine article that involves a statistical study, and write a paper answering these questions.a. Is this study descriptive or inferential? Explain your answer.b. What are the variables used in the study? In your opinion, what level of measurement was used to obtain the data
Find an article that describes a statistical study, and identify the study as observational or experimental.
Find a gambling game and explain how probability was used to determine the outcome.
Find three statistical studies and explain whether they used descriptive or inferential statistics.
In a newspaper or magazine of your choice, find a statistical study that contains an estimated population proportion.
Give an example of interest to you for comparing two population means. Identify the variable under consideration and the two populations.
In a current newspaper or magazine, find two examples of graphs that might be misleading. Explain why you think the graphs are potentially misleading.
Class Project: Number of Siblings. This exercise is a class project and works best in relatively large classes.a. Determine the number of siblings for each student in the class.b. Obtain a relative-frequency histogram for the number of siblings.Use single-value grouping.c. Obtain a simple random
In a newspaper or magazine, or on the Internet, find an example of a. A descriptive study.b. An inferential study.
Given A = {1, 4, 7}, B = {3, 4, 6, 8, 9} and C = {1, 3, 4, 5, 6, 7}, solve the following.(a) A ∪ B = __________(b) A ∩ C = __________(c) B ∩ C = __________(d) A ∪ B ∪ C = __________(e) A ∩ B ∩ C = __________(f) (A ∪ B) ∩ C = __________(g) (A ∩ B) ∪ (B ∩ C) =
Determine a possible frame for conducting random sampling in each of the following studies.(a) The average amount of overtime per week for production workers in a plastics company in Queensland.(b) The average number of employees in all Coles supermarkets in New South Wales.(c) A survey of
The Land Transport Safety Authority of New Zealand conducted a survey on public attitudes to road safety and found that 78% of New Zealanders agreed that New Zealand roads are safer to travel on. Sixty-six per cent of New Zealanders believed that drink-driving laws aimed at reducing the road toll
A study by the ASX reveals that 39% of the Australian adult population are shareholders. In addition, the study determines that 7.1% of all Australian adult shareholders have postgraduate education. Suppose 5% of all Australian adults have postgraduate education. An Australian adult is randomly
Determine the mean, variance and standard deviation of the following discrete distribution. Explain the results.x ........................... P(x)0 ...........................0.0911 ...........................0.1242 ...........................0.2763 ...........................0.2184
Solve the following problems by using the binomial formula.(a) If n = 5 and p = 0.10, find P(x = 2).(b) If n = 8 and p = 0.80, find P(x = 5).(c) If n = 10 and p = 0.70, find P(x ≥ 6).(d) If n = 13 and p = 0.50, find P(4 ≤ x ≤ 6).
Solve the following problems by using the binomial tables (table A.1 in the appendix).(a) If n = 20 and p = 0.50, find P(x = 12).(b) If n = 20 and p = 0.30, find P(x > 8).(c) If n = 20 and p = 0.70, find P(x < 12).(d) If n = 20 and p = 0.90, find P(x ≤ 16).(e) If n = 15 and p = 0.40, find
Find the mean and standard deviation of the following binomial distributions.(a) n = 20 and p = 0.70(b) n = 70 and p = 0.35(c) n = 100 and p = 0.50
A survey of holiday accommodation in New Zealand shows that in Auckland, excluding caravan parks and camping grounds, 42% were full (i.e. had no vacancies). A random sample of 25 holiday accommodation facilities (of the same capacity) in Auckland is selected at random. Assume the probability that a
A survey conducted by Certified Practising Accountants Australia to investigate the reaction to new audit standards issued by the Auditing and Assurance Standards Board finds that only 53% of Australian auditors believe the new standards have improved audit quality. Fifty-eight per cent of auditors
The normal distribution can model many real-world characteristics that can be measured. Explain why the height of 18-year-old boys, the volume contained in 2-litre bottles of a particular brand of soft drink and the time taken for marathon runners to complete a race would be expected to show
Free-range eggs are produced on a farm. The weight of these eggs is found to be normally distributed with a mean of 55 g and standard deviation of 1 g. Using the empirical rule and no calculations, determine whether a randomly chosen egg from the farm could have the following weights.(a) 51 g(b) 53
Using σ = 25 and σ = 3, calculate the corresponding z-scores for each of the following values of x.(a) 16(b) 20(c) 24(d) 28
Using σ = 100 and σ2 = 25, calculate the corresponding z-scores for each of the following values of x.(a) 85(b) 92(c) 103(d) 113
Determine the probability for the following intervals of the standard normal distribution.(a) z ≥ 1.96(b) z < 0.73(c) –1.46 < z ≤ 2.84(d) –2.67 ≤ z ≤ 1.08(e) –2.05 < z ≤ –0.87
A survey shows that one in five people aged 16 years or older do some volunteer work. If this figure holds for the entire population and if a random sample of 150 people aged 16 years or older is taken, what is the probability that more than 40 of them do some volunteer work?
Truck freight delivery times between Brisbane and Sydney have been found to be approximately normally distributed. If the average freight delivery time is 12.5 hours with a standard deviation of 0.45 hours, what is the probability that a delivery arrives after 13.5 hours?
The values of investment properties in Brisbane are normally distributed with mean $360 000 and standard deviation $60 000. An investment property is randomly selected.(a) What is the probability that the property is worth less than $300 000?(b) What is the probability that the property is worth
The age of real estate investors is found to be normally distributed with a mean of 40 years and a standard deviation of 10 years. What proportion of investors are below the age of 25?
According to the Department of Building and Housing, the average rent for a one-bedroom Auckland City apartment is NZ$314 with a standard deviation of $88. Given that rents are normally distributed, what is the probability that a student can find a one-bedroom apartment for:(a) Less than $200 per
Consider the average home loan in New Zealand of $283 000, where the standard deviation is $50 000 and home loans are normally distributed.(a) What proportion of home loans are more than $250 000?(b) What proportion of home loans are between $250 000 and $300 000?(c) If a home loan is known to be
The weights of a medium-sized loaf of homemade bread in Australia, using high-grade baking flour and a bread-making machine, have been found to be normally distributed with an average weight of 750 g and standard deviation of 10 g. What is the probability that a homemade loaf of bread will be:(a)
It is estimated that the cost of running a small car is $150 per week, based on driving 15 000km per year. Taking the cost to be normally distributed with a standard deviation of $10 per week, answer the following.(a) What proportion of small cars cost more than $170 per week to run?(b) What
The average speeds of passenger trains travelling from Kyoto to Tokyo have been found to be normally distributed with a mean of 250 km per hour and standard deviation of 30 km per hour. What is the probability that a passenger train will average:(a) less than 200 km per hour?(b) more than 300 km
Solve the following problems, assuming that the data are normally distributed.(a) The standard deviation of the distribution is 12.56, and 71.97% of the values are greater than 56. What is the value of µ?(b) The mean of the distribution is 352, and only 13.35% of the values are less than 300. What
Determine whether the following binomial distributions can be adequately approximated by a normal distribution.(a) p = 0.1, n = 10(b) p = 0.2, n = 30(c) p = 0.6, n = 15(d) p = 0.8, n = 15(e) p = 0.9, n = 60
If each of the following binomial distributions can be approximated by a normal distribution, what are the values of the mean and standard deviation?(a) p = 0.2, n = 25(b) p = 0.5, n = 25(c) p = 0.7, n = 40(d) p = 0.8, n = 40(e) p = 0.8, n = 100
In the TV game show The Price is Right, two contestants spin a wheel that is divided into 100 equal segments numbered 1 to 100. After each contestant spins the wheel and it stops, the one who lands on the number closest to 100 wins a prize. If the first contestant spins the number 80, what is the
In the TV game show Temptation, one of the temptations is the ‘temptation vault’, in which the leading contestant presses a buzzer to win a dollar amount from $1 up to $10000. What is the probability that a contestant wins more than $4000? What is the probability that more than $4000 is won
ABS data show that young full-time students work an average of 15 hours per week. If the number of hours worked is normally distributed with this mean and 10% of students work more than 25 hours a week, what is the standard deviation of the number of hours worked by students?
Let x follow an exponential distribution. Determine the following probabilities.(a) P(x ≥ 5 | ???? = 1.35)(b) P(x < 3 | ???? = 0.68)(c) P(x > 4 | ???? = 1.7)(d) P(x < 6 | ???? = 0.80)
During the dry month of December, Perth has measurable rain on average for only 2 days of the month. If the arrival of rainy days is Poisson distributed in Perth during the month of December, what is the average number of days that will pass between measurable rain? What is the standard deviation?
(a) A study is to be conducted to look at consumer gambling habits in the horseracing industry.(b) A local government wants to understand the attitudes of its ratepayers. A representative community group is to be selected and interviewed at various times during the year.(c) A potato chip
The mean of a population is 54 and the standard deviation is 10. The shape of the population is unknown. Determine the probability of each of the following occurring for this population.(a) A random sample of 38 yielding a sample mean of 56 or less(b) A random sample of 120 yielding a sample mean
List some strata into which each of the following variables can be divided.(a) Employee qualification(b) Company value(c) Car park size(d) Degree program studied by university students(e) Job description
Forty-six per cent of a population possesses a particular characteristic. Random samples are taken from this population. Determine the probability of each of the following occurrences.(a) The sample size is 60 and the sample proportion is between 0.41 and 0.53.(b) The sample size is 458 and the
Suppose the age distribution in a city is as follows.Age ......................... PercentageUnder 18 .................... 16%18–25 .......................... 19%26–50 .......................... 29%51–65 .......................... 22%Over 65 ...................... 14%A researcher is
If a university employed 3500 academic staff and a random sample of 175 academic staff was selected using systematic sampling, what value of k was used? Between what two values would the sampling selection process have started? Where would a frame for this sampling of academic staff have been
For each of the following research projects, list at least one area or cluster that could be used in obtaining the sample.(a) A study of road conditions in the North Island of New Zealand(b) A study of coalmining companies in Australia(c) A study of the environmental effects of agricultural
A population is normally distributed with a mean of 14 and a standard deviation of 1.2. What is the probability of each of the following?(a) Taking a sample of 26 and obtaining a sample mean of 13.7 or more(b) Taking a sample of 15 and getting a sample mean of more than 15.7
Give an example of how convenience sampling could be used in a study of Australian Financial Review Top 1000 CEOs to measure corporate attitudes towards paternity leave for employees.
A population has a mean of 150 and a standard deviation of 21. If a random sample of 49 is taken, what is the probability that the sample mean is:(a) Greater than 154(b) Less than 153(c) Less than 147(d) Between 152.5 and 157.5(e) Between 148 and 158?
The Department of Housing can provide apartment accommodation in a particular city. The average cost of renting a two-bedroom apartment in this city is $800 per month. What is the probability of randomly selecting a sample of 50 two-bedroom apartments in this city and getting a sample mean of
According to the ABS, the average length of stay by tourists in Queensland’s hotels, motels and serviced apartments is 2.2 days with a standard deviation of 1.2 days. A sample of 65 randomly selected tourists is taken.(a) What is the probability that the average length of stay for the 65 chosen
According to ABS figures, average weekly total earnings of all employees in Australia is $1179 per week. Take this population standard deviation to be $45 per week. If a representative random sample of 70 Australian employees is surveyed, what is the probability the sample average weekly total
A new housing estate contains 1500 houses. A sample of 100 houses is selected randomly and evaluated by a real estate agent. If the mean appraised value of a house for all houses in this area is $300000 with a standard deviation of $10500, what is the probability that the sample average is greater
The monthly mobile phone bill for all customers at a large telecommunications company is found to be normally distributed with a mean of $145.55 per month and standard deviation of $15.22 per month. What value would be exceeded by 65% of sample means if the sample size was 40?
It is estimated that 80% of occupants use electricity as their main source of heating during winter in newly constructed apartments in Auckland. A random sample of 100 apartments is selected to determine whether this figure is correct. It is found that 92 of the 100 apartments sampled use
A recent survey of Australians found that mean sleep time was 8 hours with a standard deviation of 3 hours. Assume sleep time is normally distributed. What is the probability that:(a) A randomly selected population member sleeps more than 9 hours(b) In a random sample of 42 people, the sample mean
For a population with p = 0.6, find the probability for each sample proportion and given sample size.(a) n = 12 and p̂ < 0.77(b) n = 30 and p̂ > 0.56(c) n = 65 and 0.54 < p̂ < 0.56(d) n = 100 and p̂ < 0.69(e) n = 240 and p̂ > 0.53
A population proportion is 0.32. Suppose a random sample of 40 items is sampled randomly from this population. What is the probability that the sample proportion is:(a) Greater than 0.42(b) Between 0.18 and 0.51(c) Greater than 0.30(d) Between 0.38 and 0.48(e) Less than 0.39?
According to a study undertaken in a large rural town, 15% of children aged from 10 to 16 years were found to exercise less than one hour per day. If a random sample of 35 children in this age group was selected from this town, what is the probability that more than 7 children would be found to
Use these data to construct 90%, 95% and 99% confidence intervals to estimate ?. Assume ? is 4.9. State the point estimate.
Use the following information to construct the confidence intervals specified to estimate µ.(a) 99% confidence for X̅ = 35, σ = 5.2 and n = 55(b) 95% confidence for X̅ = 85, σ = 6.3 and n = 35(c) 90% confidence for X̅ = 6.4, σ = 0.8 and n = 42(d) 85% confidence for X̅ = 22.3, σ = 2.1, N =
A company sells 25 g boxes of sultanas that are promoted as a healthy snack food option for children. The company wants to estimate the number of sultanas packed into a box. To do so, a random sample of 30 boxes of sultanas is selected during a production run. The number of sultanas in each box is
Showing 700 - 800
of 4119
1
2
3
4
5
6
7
8
9
10
11
12
13
14
15
Last
Step by Step Answers