New Semester
Started
Get
50% OFF
Study Help!
--h --m --s
Claim Now
Question Answers
Textbooks
Find textbooks, questions and answers
Oops, something went wrong!
Change your search query and then try again
S
Books
FREE
Study Help
Expert Questions
Accounting
General Management
Mathematics
Finance
Organizational Behaviour
Law
Physics
Operating System
Management Leadership
Sociology
Programming
Marketing
Database
Computer Network
Economics
Textbooks Solutions
Accounting
Managerial Accounting
Management Leadership
Cost Accounting
Statistics
Business Law
Corporate Finance
Finance
Economics
Auditing
Tutors
Online Tutors
Find a Tutor
Hire a Tutor
Become a Tutor
AI Tutor
AI Study Planner
NEW
Sell Books
Search
Search
Sign In
Register
study help
mathematics
business statistics
Business Analytics And Statistics 1st Edition Ken Black, John Asafu Adjaye, Paul Burke, Nelson Perera, Carl Sherwood, Saleh A. Wasimi - Solutions
In planning both market opportunity and production levels, being able to estimate the size of a market can be important. Suppose a nappy manufacturer wants to know how many nappies a 1-month-old baby uses during a 24-hour period. To determine this usage, the manufacturer?s analyst randomly selects
A toothbrush company sells a particular model of toothbrush nationally. The company is interested in knowing the average retail price across the country. A researcher employed by the company randomly selects 25 retailers from a database that contains all the retailers that sell this particular
A book publisher wishes to estimate the average number of printed pages in textbooks used by university students. A random sample of 65 university textbooks is selected. The average number of printed pages for this sample of textbooks is 562 pages. The sample standard deviation is found to be 97
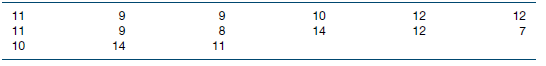
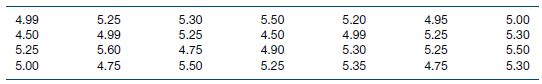
The following data are selected randomly from a population of normally distributed values. Construct a 90% confidence interval to estimate the population mean. 27.8 20.5 20.5 19.7 24.8 21.0 22.3 24.3 23.7 23.1 22.2 20.6 27.6 35.3
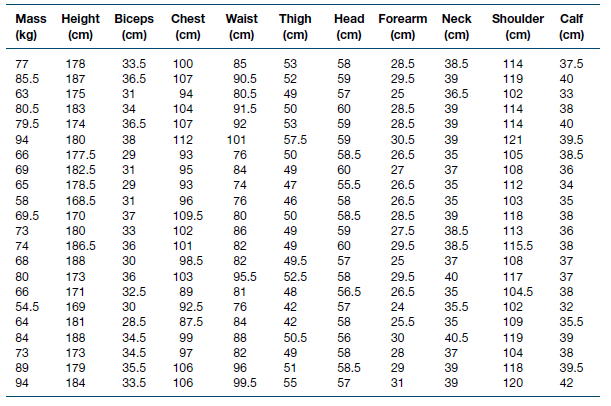
In light of your results in problem 14.27, experiment with various combinations of all of the variables in an attempt to better predict mass. Comment on your preferred model. If you are a male aged 16–30 years, use the results of your preferred model to predict your mass using the appropriate
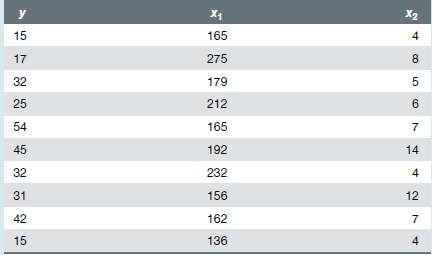
Use computer software to develop the equation of the regression model for the following data. Comment on the regression coefficients. Determine the predicted value of y for x1 =200 and x2 =7. X2 У X4 15 165 17 275 8 32 179 212 25 54 165 45 192 14 32 232 4 31 156 12 42 162 15 136
You are the manager of a removal company and want to develop a more accurate way of predicting the labour requirements for moving jobs. You decide to use the volume of goods (in cubic metres) that is being moved. You have the following data from the last 10 moves. Calculate the regression model for
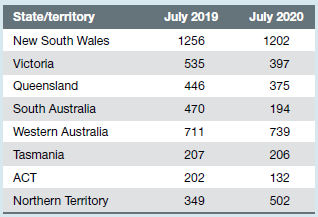
MyBank regularly conducts job advertisement surveys in Australia. The average numbers of MyBank?s online newspaper job advertisements per week in Australian states and territories in July 2019 and July 2020 are given in the following table. Test the hypothesis that the number of online newspaper
A retail store manager knows the average weekly sales revenue for last year was $42 000. The store manager also knows that weekly sales are subject to many factors and show a large amount of variability. The standard deviation for all weekly sales recorded last year was $7500. The manager wants to
A production process is known to produce output with a variance of 4 units 2. Management is concerned that the variance in the production process has changed. Data collected from a random sample of units produced during the production process are shown in the table. Using a 1% level of
Suppose a null hypothesis is that the population mean is greater than or equal to 40. Suppose further that a random sample of 52 items is taken and the population standard deviation is 8. For each of the following α values, compute the probability of committing a Type II error if the population
A national study recently reported that the average age of a female shareholder is 44 years. A broker in Adelaide wants to know whether this figure is accurate for the female shareholders in Adelaide. The broker secures a master list of shareholders in Adelaide and takes a random sample of 58
A boutique confectioner wants to estimate the difference between the average weights of its handmade chocolates sold in Sydney and Melbourne. According to the confectioner’s researcher, a random sample of 20 chocolates sold at stores in Sydney yielded a sample mean of 17.53 grams with a standard
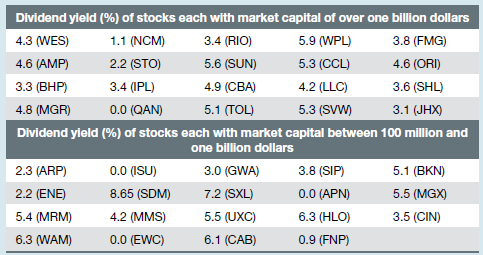
An investor on the Australian Securities Exchange (ASX) wants to check if there is a significant difference in dividend yields between stocks which have market capitals of over one billion dollars and stocks which have market capitals in the range 100 million to one billion dollars. To check, the
A medical association monitoring two groups of physicians who agreed to participate in a study over a 7-year period found that, of 3420 physicians who took aspirin daily, 147 died from a stroke or heart attack during this period. For 1705 physicians who received a placebo instead of aspirin, 78
Based on an indication that mean daily car-rental rates may be higher in Melbourne than in Sydney, a survey of eight car-rental companies in Melbourne is taken and the sample mean car-rental rate is $47 with a standard deviation of $3. Further, a survey of nine car-rental companies in Sydney
G Jones et al. studied the effect of feed withdrawal on the live weight of pigs during the weaning phase. They weighed the pigs in the evening and the following morning after a time lapse of 11 hours during which time food was withheld. The standard deviation of the weights of 52 pigs in the
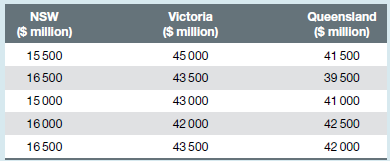
A market research firm is analysing the profits of its five largest clients in NSW, Queensland and Victoria to decide where it should prioritise its market. Use a one-way ANOVA to analyse the following data. Note that the data can be restated to make the computations easier (for example: $42 500 =
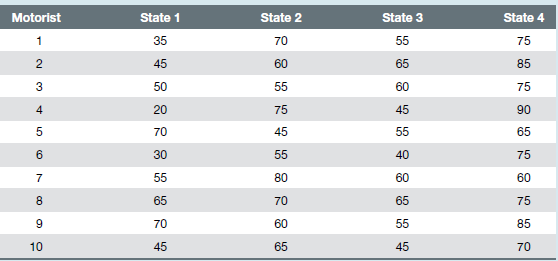
Road safety is a high priority for all levels of government. Suppose a survey was conducted by the automobile associations in four Australian states to determine motorists? views of the condition of their local roads. Each association randomly selected 10 motorists who drive an average of 1000km a
A social scientist wants to investigate whether having a university degree and staying in university longer means that having children is postponed. The researcher obtains the following data. Education ........................................ Age when first child was born12 years
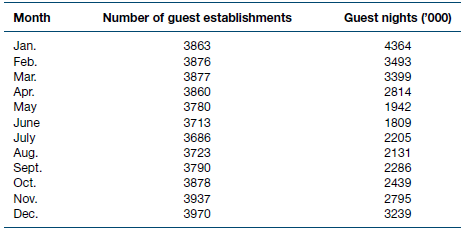
People involved in the tourism industry are interested in many aspects of tourist behaviour. An aspect that may be of interest is whether there is a relationship between demand for tourists, as measured by the number of guest nights, and the number of tourist accommodation establishments. Using the
A real estate agent researches the factors that influence house prices in Brisbane. She collects data on recent sales and notes the size of each house in square metres. Suppose the house prices (and size in square metres) for the last ten sales are as follows.Sales price ($’000)
A student researcher, Michel Larner, obtained the weight, height and various other physical measurements of 22 male subjects aged 16 to 30 years. Subjects were randomly chosen volunteers, all in reasonably good health. Michel collected measurements of mass (kg), height (cm) and circumferences (cm)
Use the data file Combaro.xls to complete the following exercises. Determine whether the relationship between productivity (Prdtvty) and days absent (DysAbsnt) is linear. Develop a regression model for productivity using days absent, job satisfaction (JobSat) and unpaid overtime (UOv- Time). Is
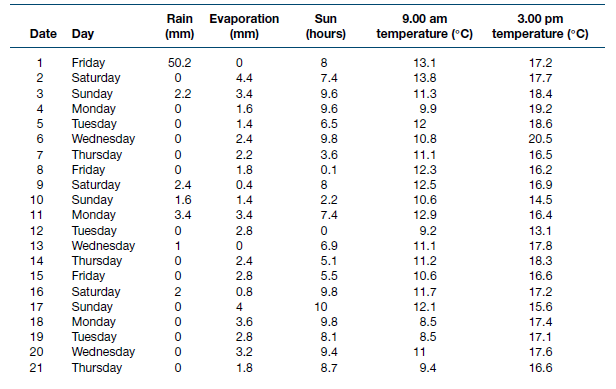
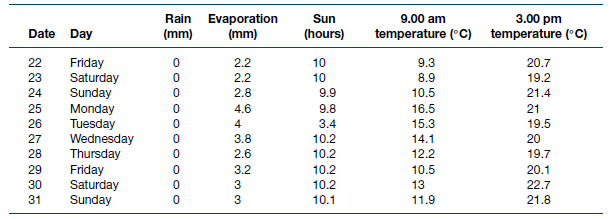
Before heading to the beach in the afternoon in mid-winter, hardy Sydney surfers are interested in what the temperature is likely to be given the temperature at breakfast time. Afternoon temperatures, however, are also likely to be affected by other meteorological factors, such as precipitation and
The table shows annual time-series data for New Zealand exports taken from the World Bank’s World Development Indicators. Use these data to develop an autoregressive forecasting model with a two-year lag. Predict exports in year 24.Year .................................. Real GDP1
The banking industry claimed that 80% of its customers aged over 65 used computers at home to make regular bill payments online for such things as electricity, gas and telephone. An independent research company decided to test this claim. A random sample of 150 bank customers over age 65 was
You are interested in testing H0: p ≥ 0.63 versus Ha: p < 0.63. From a random sample of 100 people, there are 55 people with a particular characteristic of interest that you are testing. Use a 0.01 level of significance to test this hypothesis.
You are testing H0: p ≥ 0.25 versus Ha: p < 0.25. A random sample of 146 people gives a value of p̂ = 0.21. Using α = 0.10, test this hypothesis.
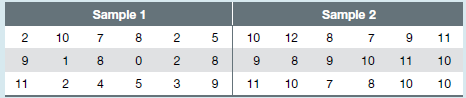
Suppose you want to determine whether the average values for populations 1 and 2 are different, and you randomly gather the following data. (a) Test your conjecture, using a probability of 0.01 of committing a Type I error. Assume that the population variances are the same and x is normally
In previous years, the average market price of warehouses in a particular city equated to $322.80 per m2 of usable floor space. An investor wants to determine whether this figure has changed. A researcher is hired who randomly samples 19 warehouses that are for sale in the city and finds that the
Across the country, families of two adults and two children currently have an average weekly shopping bill at a large supermarket chain of $255. However, you believe the weekly bill for this type of family in your local area is more than the national average figure. You decide to test your claim by
The following data represent the recorded weights (g) of a randomly selected sample of a particular car component. The manufacturing specifications require this car component to have an average weight of 6 g. The weights of this car component can be taken to be normally distributed. Use these data
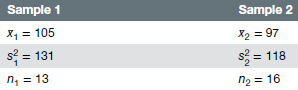
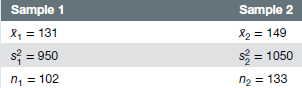
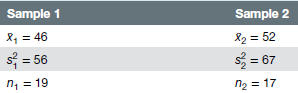
Use the sample information provided to construct the required confidence interval for the difference between the two population means. (a) a 90% confidence interval (b) a 95% confidence interval (c) a 99% confidence interval (d) an 80% confidence interval (e) a 98% confidence interval
A company’s auditor believes the per diem cost in Darwin rose significantly between 2013 and 2020. To test this belief, the auditor samples 51 business trips from the company’s records for 2013; the sample average was $190 per day with a population standard deviation of $18.50. The auditor
A survey shows that the average insurance cost to a company per employee per hour is $1.84 for managers and $1.99 for professional specialty workers. Suppose these figures were obtained from 35 managers and 41 professional specialty workers and that their respective population standard deviations
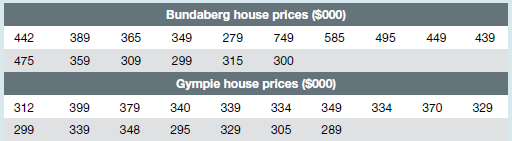
The website www.domain.com.au lists houses for sale in Australia. The asking prices of established houses with 4 bedrooms, 2 bathrooms and 2 car spaces for sale in August 2009 in Bundaberg (central and adjoining suburbs), Queensland 4670 and Gympie, Queensland 4570 are given in the table (in
A report indicated the many health benefits of consuming cheese as part of a healthy diet. It also claimed that the average sodium content in cheese is 1000mg per 100 g. Thinking this figure seemed high, a researcher decided to test this claim. A random sample of 14 different types of cheese was
Changes in lifestyles over the years are believed to see families now eating more takeaway food at home for dinner than previously. It is claimed the proportion of families who now eat at least one takeaway meal per week as the family dinner is 75%. To test this claim, a random sample of 250
A manufacturing company has been averaging 18.2 orders per week for several years. However, during a recession weekly orders have appeared to slow. Suppose the company’s production manager randomly samples 32 weeks during the recession period and finds a sample mean of 15.6 orders per week. The
According to a recent survey, the average urban person consumes 1.5 kg of food per day. Is this figure also true for rural people? Suppose 64 rural people are identified by a random procedure and their average consumption per day is 1.57 kg of food. Assume a population variance of 0.52 kg2 of food
Amanufacturing company makes steel wire. One particular steel wire is very thin and has a designed breaking load of 5 kg. The company tests a random sample of 42 lengths of wire and finds the mean breaking load is 5.0611 kg. The wire-production machine has a specification such that the standard
A property developer proposed to construct a new shopping centre in an environmentally sensitive area. It was believed 80% of residents in the community were opposed to the development. The developer therefore decided to undertake an extensive advertising campaign in order to try to get popular
The average annual income for Australian childcareworkers five years agowas $38100. It is believed this average annual income has essentially remained the same since then. To test this hypothesis, a random sample of 22 Australian childcare workers is selected and the average annual salary is found
Research has found that the average number of suspended particles of air in a particular city is currently 80 micrograms per cubic metre. Suppose city officials work with businesses, commuters and industries, and introduce initiatives to try to reduce this figure. These officials hire an
(a) Use the data given to test the following hypotheses.H0: μ = 18; Ha: μ ≠ 18x̅ = 16.7; n = 31; σ = 4.2; α = 0.05(b) Use the p-value to reach a statistical conclusion.(c) Using the critical value method, what are the critical sample mean values?
From the information given, indicate if a correct decision, a Type I error or a Type II error was made.(a) H0: μ = 1.5 litres. The decision was to not reject H0 and μ is actually 1.5 litres.(b) H0: μ = 1.5 litres. The decision was to not reject H0 and μ is actually 1.6 litres.(c) H0: μ = 1.5
The critical value for a specific left-tailed hypothesis test is given as −1.645. Depending on the sample selected for the hypothesis test, the calculated test statistic can vary. For each of the following test statistics, indicate whether to reject the null hypothesis.(a) −2.8(b) −1.7(c)
A fuel company wishes to determine the proportion of cars that fill up using 95-octane petrol. This population proportion needs to be estimated to within 5% and with a 99% level of confidence. Assuming there is no information regarding this population proportion, how large a sample should be
Determine the sample size necessary to estimate μ for the following information.(a) σ = 20 and ME = 2.5 at 99% confidence(b) σ = 10.2 and ME= 1.5 at 95%confidence(c) Values range from 60 to 460, error is to be within 15 and the confidence level is 99%(d) Values range from 30 to 90, error is to
C-type batteries have a nominal diameter of 26.2 mm. Producing batteries with this value will ensure they fit properly into all toys and appliances that require C-type batteries. A tolerance variation of 0.000225 mm2 (? = 0.015 mm) is allowable. After repair, a machine produces a batch of 12 C-type
A study reveals that the average amount withdrawn at automatic teller machines (ATMs) is $160 per withdrawal. This figure was determined using a random sample of 91 withdrawals at ATMs. The sample standard deviation is calculated to be $10 per withdrawal. Assume the dollar values of the withdrawals
For each of the following sample results, construct the requested confidence interval. Assume thatthe data come from normally distributed populations.(a) n = 14, x̅ = 30, s2 = 17.2; 98% confidence for σ2(b) n = 9, x̅ = 7.2, s = 1.53; 90% confidence for σ2(c) n = 22, x̅ = 136, s = 6.5; 85%
A regional town-planning department wants to determine the proportion of residential houses in its region that have air conditioning. To do so, a random sample of 80 houses across the region is selected and 56 of those are found to have air-conditioning. From these data, what is the 95% confidence
The critical values for a particular two-tailed hypothesis test are given to be −1.96 and 1.96. Depending on the sample selected, the calculated test statistic can vary. For each of the following possible test statistics, indicate whether to reject the null hypothesis.(a) −2.8(b) −1.97(c)
A candidate is considering nominating for an election to become mayor of a country town. Prior to officially nominating, the candidate decides to conduct a survey to assess their chances of being elected; 90 voters are randomly selected with 55 indicating they will vote for the candidate. Find a
For each of the hypothesis statements in problem 9.1, is a two-tailed test or one-tailed test needed? If it is a one-tailed test, indicate if it is a left tailed or right-tailed test.Problem 9.1(a) The mean length of a piece of ribbon increased to above 15 cm.(b) The population proportion is the
Use the information about each of the following samples to compute the confidence interval to estimate p.(a) n = 25 and p̂ = 0.24; 98% confidence interval(b) n = 142 and p̂ = 0.61; 92% confidence interval(c) n = 213 and p̂ = 0.38; 95% confidence interval(d) n = 62 and p̂ = 0.73; 80% confidence
For each of the following, state the null and alternative hypotheses.(a) The mean length of a piece of ribbon increased to above 15 cm.(b) The population proportion is the same as the historical value of 50%.(c) The average height of a 32-year-old male in a community is claimed to be at most 180
A national survey of a large supermarket chain is undertaken. Data are collected for the price of a particular brand of natural yoghurt. The data are shown below. Assuming the prices of natural yoghurt are normally distributed, find a 95% confidence interval for the population variance of prices
Many fast-food chains offer a lower priced combinationmeal in an effort to attract budget-conscious customers. One chain tested a burger, chips and drink combination for $6.95. The weekly sales volume for these meals was impressive. Suppose the chain wants to estimate the average amount its
A research company has been asked to determine the proportion of all restaurants in Western Australia that serve alcoholic beverages. The company wants to be 98% confident of its results, but has no idea what the actual proportion is. It would like to report an error of no more than 0.05. How large
According to Runzheimer International, organisations are investing an average of $1436 each year per mobile device. A researcher randomly selects 28 organisations and calculates the average amount they invested during the year on mobile devices to be $1295. The sample standard deviation is
According to a survey, the average cost of a fast-food meal (cheeseburger, large chips, medium soft drink) in Christchurch is $7.25. Suppose this figure is based on a sample of 27 different establishments and the standard deviation is $0.60. Construct a 95% confidence interval for the population
A coin-operated laundromat is for sale. An investor wants to determine the average daily revenue generated by this business. An estimate of the average daily revenue is to be found using a random sample. A good estimate of the population standard deviation has been determined to be $85 per day for
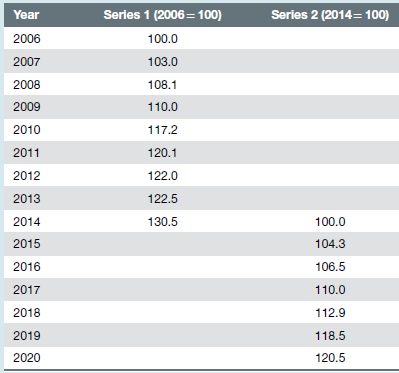
The table presents two price index series, one with 2006 = 100 for the period 2006 to 2014 and the other with 2014 = 100 for the period 2014 to 2020. Construct a single series for the period 2006 to 2020, using 2014 as the base year. How much have prices risen during this period? Series 1 (2006 =
From 2015 to 2020, the average hourly earnings of production workers in a certain factory went from $9.85 to $17.36, and the consumer price index went from 82.4 to 152.4. What was the percentage increase or decrease in the average worker’s real earnings? Explain your result.
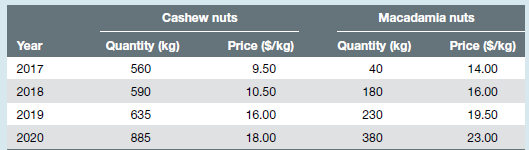
The table summarises the unit sales and prices for a food manufacturer from 2017 to 2020. Using 2017 as the base year, construct an unweighted price index, a Laspeyres index and a Paasche index. Interpret each index and explain any differences that you find in your results. Cashew nuts Macadamla
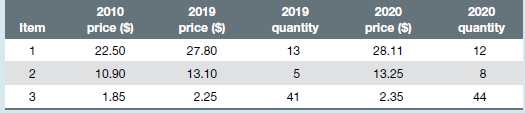
Calculate Paasche price indices for 2019 and 2020 using these data and 2010 as the base year. 2019 price ($) 2019 2010 price ($) 2020 2020 price ($) Item quantity 13 quantity 12 27.80 22.50 28.11 13.10 13.25 8 10.90 1.85 3 2.25 2.35 41 44
Calculate Laspeyres price indices for 2018?20 from these data. Use 2010 as the base year. 2010 price ($) 2019 price ($) 0.68 2010 2018 price ($) 2020 price ($) Item quantity 21 0.67 0.71 0.50 1.23 1.85 1.91 1.90 0.84 0.75 0.75 17 0.80 0.21 0.25 0.25 4 43 0.15
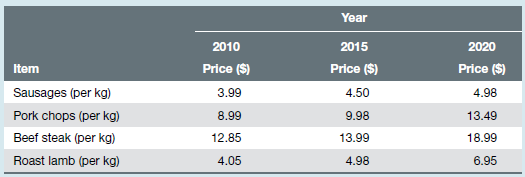
Using these price data collected from Hobart supermarkets, compute the unweighted aggregate price index numbers for the four types of meat. Let 2010 be the base year for this market basket of goods. Year 2010 2015 2020 Price ($) Item Price ($) Price ($) Sausages (per kg) Pork chops (per kg) Beef
The table gives the price of a basket of groceries in a certain city from 2014 to 2020. Find the simple index numbers for the data.(a) Let 2014 be the base year.(b) Let 2016 be the base year.Year ................................ Price ($)2014 ................................ 60.502015
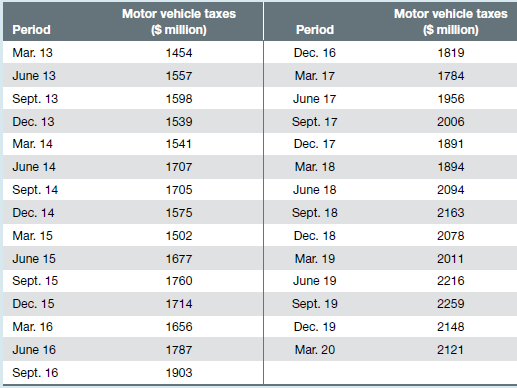
The table shows quarterly data for motor vehicle taxes collected by the federal government in Australia for the period March 2013 to March 2020. (a) Develop 2-lag and 4-lag models. (b) Determine the forecast for the June 2020 quarter. (c) Compute a Durbin?Watson statistic to determine whether
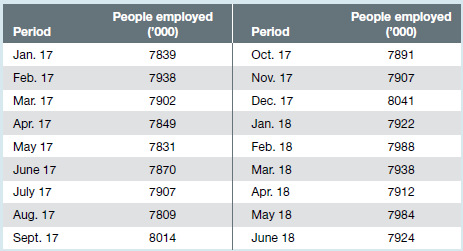
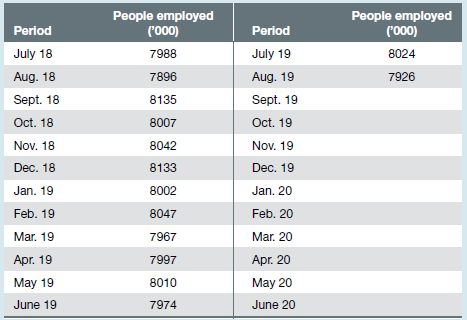
The monthly time-series data for the number of people employed on a full-time basis are shown in the table. Plot these data. Estimate the following forecasting models: linear trend, quadratic trend and exponential trend. Compute a forecast for the number of people employed in July 2020 with each
Time-series data for the number of owner-managers of unincorporated businesses in Australia (’000s) are shown in the table. Fit an exponential trend model to the data and forecast the number of owner-managers for period 14.Period .......................... Number of owner-managers (’000)1
Data for the number of internet subscribers (in thousands) in Australia for June 2015 to December 2019 are shown below. Fit a quadratic trend model to the data and predict the number of internet subscribers in January 2020. June 15 ..................................... 8 420Dec. 15
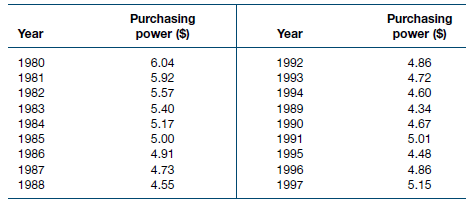
The values of purchasing power for the minimum wage in 1997 dollars for the years 1980 to 1997 are shown in the table. Use these data and exponential smoothing to develop forecasts for the years 1981 to 1997. Use ? = 0.1, 0.5 and 0.8, and compare the results using MAD. Discuss your findings. Select
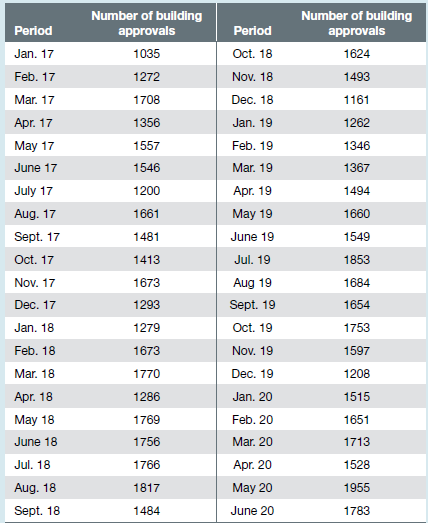
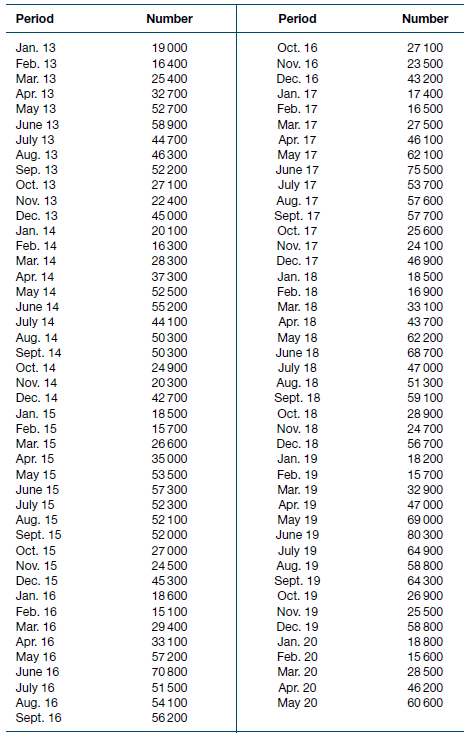
The table shows monthly ABS data for approvals for residential buildings in South Australia for the period January 2017 to June 2020. Estimate the data using a linear trend model. Forecast the number of building approvals in July 2020. Number of building Number of building approvals approvals
These data give monthly figures for standard variable interest rates in Australia over a 4-year period. Use the data to develop an autoregressive model with a 6-month lag. Discuss the strength of the model.Period ........................................ Standard variable
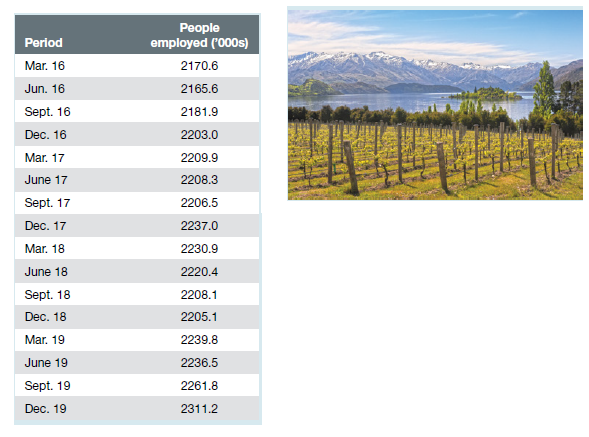
Shown are Statistics New Zealand quarterly data for the total number of people employed in New Zealand for the period March 2016 to December 2019. Calculate seasonal indices for the data. Deseasonalise the data and plot a graph of the original series and the deseasonalised series. Comment on your
The table gives ABS data for finance provided for the construction of dwellings in New South Wales for January 2018 to May 2020.(a) Evaluate how well the following trend models fit the data: linear, quadratic and exponential.(b) Plot the residuals over time and comment on the results.(c) At the
The ABS publishes census information on manufacturing. Included in these figures are quarterly production figures for electricity (million kilowatt hours) for five years. Use the data in the P15-08.xls file from the student website to analyse the effects of seasonality, trend and cyclicality.
The following table shows exports of machinery and transport equipment (in millions of dollars) from September of year 1 to April of year 4. Use these data to develop autoregressive models for a 1-month lag and a 4-month lag. Compare the results of these two models. Which model seems to yield
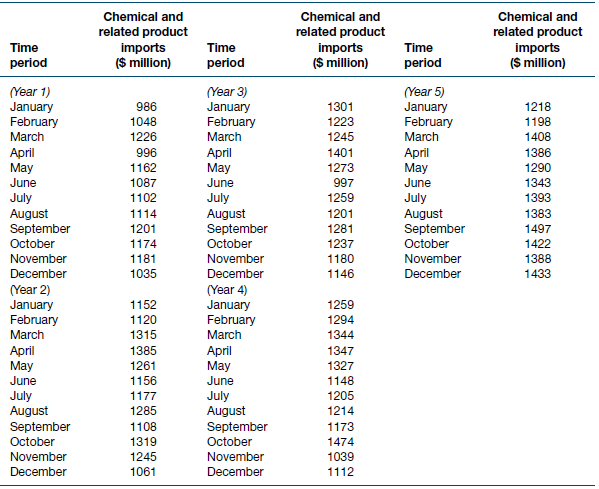
The ABS publishes a series on Australia?s international merchandise imports and exports. The table displays a portion of the data for imports of chemicals and related products from January of year 1 to December of year 5. (a) Use time-series decomposition methods to develop the seasonal indices
These are retail turnover data for supermarkets and grocery stores in New South Wales for the period August 2018 to June 2020.(a) Use these data to develop forecasts for the above period using a 3-period MA.(b) Use these data to develop forecasts for the above period using a 3-period weighted
The table shows quarterly data for household consumption expenditure in Australia for the period from March 2016 to December 2019. Compute the seasonal indices and then use them to deseasonalise the data.
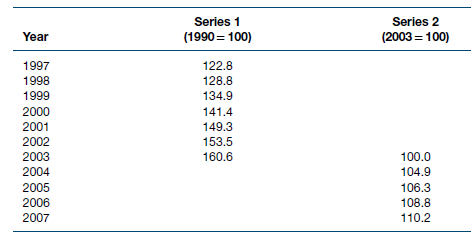
These are data on two CPI series for food. The first series is for the period 1997 to 2003 with 1990 = 100, and the second is for the period 2003 to 2007 with 2003 = 100. Combine the two into a single series for the period 1997 to 2007, using 2003 as the base year. Series 1 Series 2 (1990 = 100)
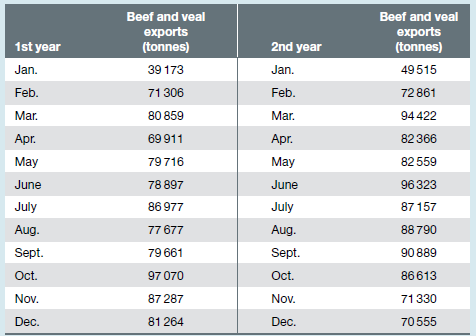
The ABS publishes statistics on the exports of various types of agricultural commodities by month. Shown here are the export figures on fresh, chilled and frozen beef and veal (tonnes) for January of a recent year to December of the next year. Use these data to compute 12-month centred MAs (TC) and
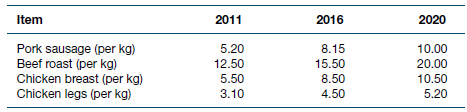
Compute unweighted aggregate price index numbers for each of the given years using 2011 as the base year. 2011 2016 Item 2020 Pork sausage (per kg) Beef roast (per kg) Chicken breast (per kg) Chicken legs (per kg) 8.15 15.50 8.50 4.50 5.20 12.50 5.50 3.10 10.00 10.50 5.20
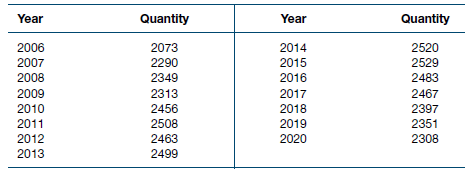
Using these data, compute index numbers for 2017 to 2020 using 2006 as the base year. Year Year Quantity Quantity 2073 2290 2349 2313 2456 2508 2463 2499 2520 2529 2483 2006 2007 2008 2009 2010 2011 2012 2013 2014 2015 2016 2017 2018 2019 2020 2467 2397 2351 2308
The table shows monthly time-series data for short-term visits to the United Kingdom and its territories by Australian residents. (a) Explore trends in these data by using linear and quadratic trend models. Comment on the performance of these models. (b) Use a 10-month MA to forecast values for
Using the data in Combaro.xls on the student website, develop a multiple regression model to predict productivity (Prdtvty) using days absent (DysAbsnt), job satisfaction (JobSat) and unpaid overtime (UOvTime). Discuss the output and pay particular attention to the F test and t tests.
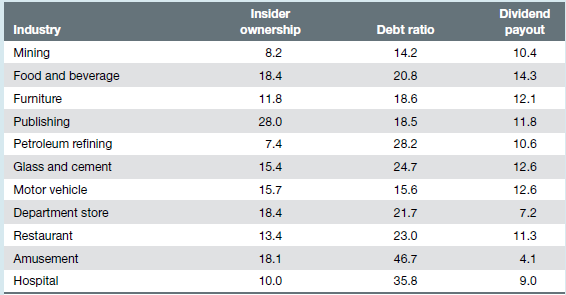
Jensen, Solberg and Zorn investigated the relationship between insider ownership, debt and dividend policies in companies. One of their findings was that companies with high insider ownership choose lower levels of both debt and dividends. The following is a sample of data of these three variables
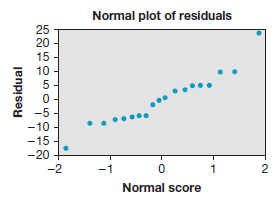
Study the following residual diagnostic graph. Comment on any possible violations of regression assumptions. Normal plot of residuals 25 20 15 10 0어 -5 -10 -15 -20 -2 -1 Normal score Residual
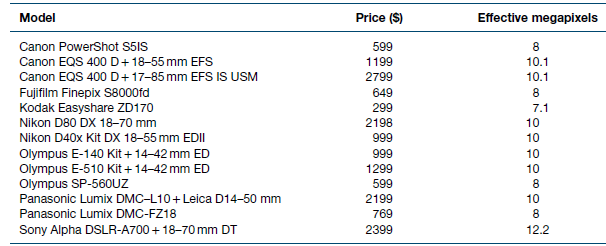
Nowadays, there are a wide range of digital cameras available with many different features and price tags. The following table lists the prices and effective megapixels of some of these cameras. Suppose a potential buyer is interested in finding out if there is a positive relationship between
Use Excel or a calculator to complete parts (a) to (f) for the following data. (a) Determine the equation of the least squares regression line to predict y using x. (b) Obtain the predicted values of y and the residuals. (c) Find the value of se and interpret it with respect to the regression
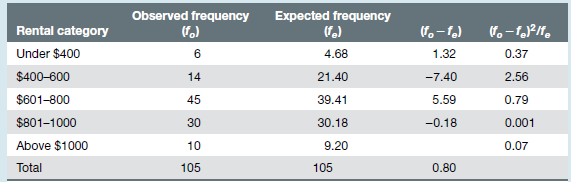
An investor wants to know whether the distribution of weekly rental values in a certain location is normal. The results of her test are as shown. Discuss the test used, the hypotheses, the results and the business implications. Use ? = 0.05. Observed frequency Expected frequency Rental category
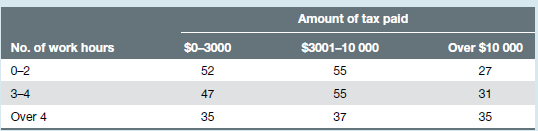
An accounting firm studied the time its accountants took to complete each client?s tax return and related this to the amount of tax paid by the client. The firm wants to know whether a relationship exists between these two variables, as it is considering a new pricing policy that would depend on
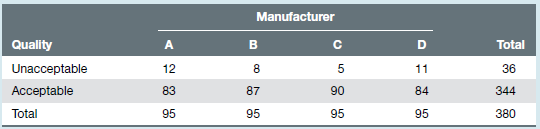
A computer manufacturer is considering sourcing supplies of an electrical component from one of four different manufacturers. The purchasing manager asks for 95 samples from each of the manufacturers. The numbers of acceptable and unacceptable components from each manufacturer are shown in the
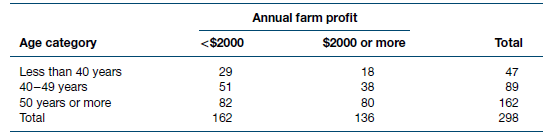
The following is a 3 ? 2 contingency table for annual farm profit and the age of the farmer for a randomly selected sample of farmers in Fiji. Use an appropriate test to determine whether annual farm profit is related to a farmer?s age. Comment on the results of your test. Annual farm profit $2000
Showing 800 - 900
of 4119
First
2
3
4
5
6
7
8
9
10
11
12
13
14
15
16
Last
Step by Step Answers