

The table presents two price index series, one with 2006 = 100 for the period 2006 to 2014 and the other with 2014 = 100
The table presents two price index series, one with 2006 = 100 for the period 2006 to 2014 and the other with 2014 = 100 for the period 2014 to 2020. Construct a single series for the period 2006 to 2020, using 2014 as the base year. How much have prices risen during this period?
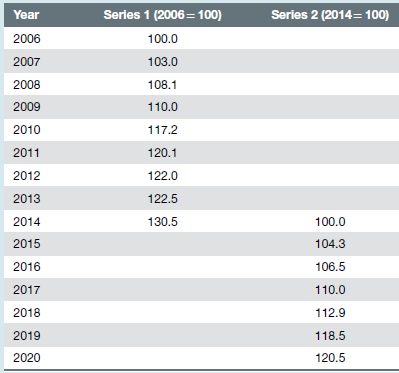
Series 1 (2006 = 100) Series 2 (2014= 100) Year 2006 100.0 2007 103.0 108.1 2008 2009 110.0 2010 117.2 2011 120.1 2012 122.0 2013 122.5 100.0 2014 130.5 2015 104.3 2016 106.5 2017 110.0 2018 112.9 2019 118.5 2020 120.5
Step by Step Solution
3.39 Rating (165 Votes )
There are 3 Steps involved in it
Step: 1
Since the series overlap in 2014 multiply each index number in the old series by Year Series 1 S... View full answer

Get step-by-step solutions from verified subject matter experts
100% Satisfaction Guaranteed-or Get a Refund!
Step: 2Unlock detailed examples and clear explanations to master concepts

Step: 3Unlock to practice, ask and learn with real-world examples
See step-by-step solutions with expert insights and AI powered tools for academic success
-
 Access 30 Million+ textbook solutions.
-
Ask unlimited questions from AI Tutors.
-
Order free textbooks.
-
100% Satisfaction Guaranteed-or Get a Refund!
Claim Your Hoodie Now!
Authors: Ken Black, John Asafu Adjaye, Paul Burke, Nelson Perera, Carl Sherwood, Saleh A. Wasimi
1st Edition
0-730-35543-4, 978-0730363330

Study Smart with AI Flashcards
Access a vast library of flashcards, create your own, and experience a game-changing transformation in how you learn and retain knowledge
Explore Flashcards

