All Matches
Solution Library
Expert Answer
Textbooks
Search Textbook questions, tutors and Books
Oops, something went wrong!
Change your search query and then try again
Toggle navigation
FREE Trial
S
Books
FREE
Tutors
Study Help
Expert Questions
Accounting
General Management
Mathematics
Finance
Organizational Behaviour
Law
Physics
Operating System
Management Leadership
Sociology
Programming
Marketing
Database
Computer Network
Economics
Textbooks Solutions
Accounting
Managerial Accounting
Management Leadership
Cost Accounting
Statistics
Business Law
Corporate Finance
Finance
Economics
Auditing
Hire a Tutor
AI Study Help
New
Search
Search
Sign In
Register
study help
mathematics
business statistics
Questions and Answers of
Business Statistics
Think of a question that you’d like to know the answer to that might be answered with a survey. What are the questions? Identify the variables and answer the questions above.
Look in the latest edition of your local newspaper and find examples of each level of measurement. Write a brief memo summarizing your findings.
Consider again the post-1960 trend in U.S. GDP we examined in Exercise 57. Here are a regression and residual plot when we use the square root of GDP in the model. Is this a better model for GDP?
An experiment on laboratory rats finds that rats that are randomly assigned to higher levels of noise take longer to finish a maze than those that try the same maze under less noise. The P-value for
An observational study finds that the average number of years that people stay married differs by educational level with a P-value 60.0001. The higher the education level, the longer people tend to
Your manager asked you to fit many models to predict which customers will buy this holiday season. The firm is going to pick only one. What criteria would you recommend that the firm use to evaluate
Your manager wants to just find and use “the best” model, but you have found that a combined model (boosting) is better. Explain why boosting might help, and why it may be better than trying to
What are the pros and cons of combining multiple models to produce a prediction? Should we always combine models?
Your manager wants to use the total accurate classification rate (percent of all cases properly classified) as the metric to evaluate the division’s models. Is this a good idea? Why or why not?
Is any one portion of the CRISP-DM more important than the others? Why?
Your manager has read a couple of articles about data mining and artificial intelligence. He wants to use data mining to find the best customers. What would you suggest to structure this problem?
Your manager learned all about databases, and frequently makes queries such as: “What fraction of our customers who bought a product in the last six months are female and live within 5 miles of the
Your manager is confused by Big Data. Explain what makes “big data”different than “data.”
Heart disease is the leading cause of death for both men and women. According to the Centers for Disease Control and Prevention, as of 2013, about 715,000 heart attacks occur in the United States
Tiffany was founded in 1837, when Charles Lewis Tiffany opened his first store in downtown Manhattan. Tiffany retails and distributes a selection of Tiffany & Co. brand jewelry at a range of
In 2016, 13.27 million people attended a Broadway show, paying an average of more than $100 per ticket. We?d like to understand this $1.4 billion business better. The Broadway League, Inc. (www
The scatterplot shows the gross domestic product (GDP) of the United States in trillions of (2010) dollars plotted against years since 1960. (Data in GDP and DJIA 2017) A linear model fit to the
Renewable sources of energy are of growing importance in the economy. The Energy Information Administration reports the amount of renewable energy generated (in thousands of kilowatt-hours) in each
The gross domestic product (GDP) per capita is a widely used measure of a country’s (or state’s) economy. It is defined as the total market value of all goods and services produced within a
Here is a scatterplot showing the regression line, 95% confidence intervals, and 95% prediction intervals, using 2015 and 2016 male unemployment data for a sample of 33 nations. The response variable
The Worldwide Cost of Living Survey published by Numbeo.com provides an index that expresses the cost of living in other cities as a percentage of the New York cost. For example, in 2017, the cost of
There are 168 hours in a week. If you spend all of it sleeping and having fun, you will earn very little money. On the other hand, if you spend much of it working, do you earn more? In other words,
In 2014, cnet.com listed the battery life (in hours) and maximum luminous intensity (i.e., screen brightness, in cd>m2) for a sample of tablet computers. We want to know if we can predict battery
Using unemployment data provided by the World Bank, investigate the association between the male unemployment rate in 2014 and 2017.a) Find a regression model predicting the 2017 rate from the 2014
Every spring, Nenana, Alaska, hosts a contest in which participants try to guess the exact minute that a wooden tripod placed on the frozen Tanana River will fall through the breaking ice. The
The product manager at a subsidiary of Kraft Foods, Inc., is interested in learning how sensitive sales are to changes in the unit price of a frozen pizza in Dallas, Denver, Baltimore, and Chicago.
The U.S. Bureau of Economic Analysis provides information on the Gross Domestic Product Per Capita (GDP PC) in the United States by state (www.bea.gov). The Bureau recently released figures that
Every year, Fortune magazine lists the 100 best companies to work for, based on criteria such as pay, benefits, days off, and diversity. In 2018, the top three were Sales Force, Wegmans Food Markets,
A similar Pew poll in 2016 asked people how often they used the Internet. (Data in Income and internet) a) Under the usual null hypothesis, what are the expected values? b) Compute the x2
In 2010, the U.S. Congress passed the historic health care reform bill that will provide some type of coverage for the millions of Americans without health care insurance. Just how widespread is the
American League baseball teams play their games with the designated hitter rule, meaning that pitchers do not bat. The league believes that replacing the pitcher, traditionally a weak hitter, with
Most car engines need at least 87 octane to avoid “knocking” or “pinging,” terms used to describe the preignition that can happen when a fuel’s octane is too low. An engineer is designing
Using the Paralyzed Veterans dataset, construct a 95% confidence interval for the mean age of a potential donor to the Paralyzed Veterans. Test the hypothesis that the mean age is 62 years old.
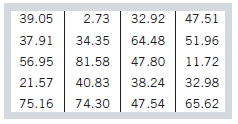
Exercise 55 Here are the data from the researcher studying the reaction times of rats. He has a requirement that the maze take about a minute to complete on average. ? ? ? ? ? Time (sec)38.4
According to www.marketingcharts.com/, the average 18–24-year old has 649 Facebook friends. The student who collected the survey data in Student survey wanted to test if the mean number is higher
Here are the data from the researcher studying the reaction times of rats. He has a requirement that the maze take about a minute to complete on average. Time
Instead of advertising the percentage of customers who improve by at least 10 points, a manager suggests testing whether the mean score improves at all. For each customer they record the difference
A test preparation company claims that more than 50% of the students who take their GRE prep course improve their scores by at least 10 points.a) Is the alternative to the null hypothesis more
How far do professional golfers drive a ball? (For non-golfers, the drive is the shot hit from a tee at the start of a hole and is typically the longest shot.) Here?s a histogram of the average
A business statistics class conducted a student survey in which 299 students were randomly selected and asked a variety of questions. One of the questions asked ?How many friends do you have on
The Framingham Heart Study recorded the cholesterol levels of more than 1400 participants in Framingham, MA (Data in Framingham). To find a bootstrap confidence interval for the mean cholesterol, a
In 2011, when the Gallup organization polled investors, 34% rated gold the best long-term investment. But in April of 2017 Gallup surveyed a random sample of U.S. adults
Giant food stores serves two customer segments: ?Budget Shoppers? and ?Foodies.? Giant sends 1000 of each type of customer one of two circulars: Deep Discounts or Gourmet Food. The response is the
Verizon Wireless wants to test new package deals. They are considering offering three levels of data per month (5 Gb, 10 Gb, Unlimited) and two different international calling options (no
Kraft foods wants to see whether a coupon will affect sales for macaroni and cheese. Kraft picks a single grocery store in Philadelphia in which to test two coupon types: ?buy one, get one free? and
A small maker of video games designs a pricing experiment. They know that some teens self-identify as ?gamers,? while others do not. They market a new video game to gamers and non-gamers, and they
Exercise 28 A supermarket wants to see the effects of coupons on spending. They believe that male and female heads of households will respond differently to the coupons. The supermarket chooses 200
A supermarket wants to see the effects of coupons on spending. They believe that male and female heads of households will respond differently to the coupons. The supermarket chooses 200 males and 200
GfK Roper Consulting conducts market research for multinational companies who want to understand attitudes in different countries so they can market and advertise more effectively to different
The monthly exchange rates for the five-year period October 2012 to October 2017 between the euro (EUR) and the British pound (GBP) can be modeled by a Normal distribution with mean 1.24 euros (to
In the first quarter of 2017, a group of domestic equity mutual funds had a mean return of 6.2% with a standard deviation of 1.8%. If a Normal model can be used to model them, what percent of the
Lifetimes of electronic components can often be modeled by an exponential model. Suppose quality control engineers want to model the lifetime of a hard drive to have a mean lifetime of 3 years.a)
Jeff, a sales manager of a car dealership, believes that his sales force sells a car to 35% of the customers who stop by the showroom. He needs the dealership to make 50 sales this month to get a
The U.S. Census Bureau’s 2012 Survey of Business Owners (www.census.gov/newsroom/press-releases/2015/ cb15-209.html) showed that 35.8% of all non-farm businesses are owned by women. You are phoning
A Pew Research report on September 13, 2017, reported that 61% of 18?29 year olds watch TV using online streaming services. (By contrast, only 5% of those 65 and older watch online.) The table below
A global survey firm reports data from surveys taken in several countries. The data file Global holds data for 800 respondents in each of five countries. The variables provide demographic information
Here are the number of domestic f lights flown in each year from 2000 to 2016 (www.transtats.bts .gov/homepage.asp):Year ................................... Flights2000
Here are engine size (displacement, in liters) and gas mileage (estimated combined city and highway) for a random sample of 35 2016 model cars (taken from Fuel Economy 2016 and identified in the data
Concern over the weather associated with El Ni?o has increased interest in the possibility that the climate on Earth is getting warmer. The most common theory relates an increase in atmospheric
Numbeo.com collects data from users in cities around the world on prices of a basket of goods and services and uses these data to determine a cost of living index. This index scales New York City as
Perhaps fans are just more interested in teams that win. The displays below are based on American League teams for the 2016 season. (Data in Attendance 2016) a) Do winning teams generally enjoy
Is economic growth in Europe related to growth in the United States? Here?s a scatterplot of the average growth in the 19 European countries (% of Gross Domestic Product) vs. the growth in the United
Is economic growth in the developing world related to growth in the industrialized countries? Here?s a scatterplot of the growth (in % of Gross Domestic Product) of the least developed countries (as
An economics student is studying the American economy and finds that the correlation between the inf lation-adjusted Dow Jones Industrial Average and the Gross Domestic Product (GDP) (also inf lation
The scatterplot shows, for 2015 cars, the carbon footprint (tons of CO2 per mile) vs. the new Environmental Protection Agency (EPA) highway mileage for 69 family sedans as reported by the U.S.
The 30 quarterbacks in Exercise 32 had an average Salary of $13,788,022 1SD = $8,130,5362. The correlation between Salary and Total QBR = 0.278. If a player had a Total QBR rating 1 SD below the
In 2016, the Los Angeles Dodgers spent nearly one quarter billion (!) dollars on salaries for their players (Spotrac). Is there a relationship between salary and team performance in Major League
Is there a relationship between total team salary and the performance of teams in the National Football League (NFL)? For the 2016?2017 season, a linear model predicting Wins (out of 16 regular
The average salary for 30 top NFL quarterbacks in 2017 was just over $13,000,000. A linear model to predict Salary from Total QBR (an overall measure of performance based on game statistics) found
According to the U.S. Securities and Exchange Commission (SEC), a mutual fund is a professionally managed collection of investments for a group of investors in stocks, bonds, and other securities.
Rebekkah Greene, owner of Up with Life Café and Marketplace, is a true believer in the health and healing benefits of food. She offers her customers pure, wholesome, and locally sourced products.
Here is a histogram of the monthly CPI as reported by the Bureau of Labor Statistics (www.bls.gov/cpi) from January 2007 through August 2017. Here is the time series plot for the same data. a)
The histogram shows themonthly U.S. unemployment rate from January 2003 toAugust 2017. Here is the time series plot for the same data. a) What features of the data can you see in the histogram
Standard and Poor’s Case- Shiller Home Price Index measures the residential housing market in metropolitan regions across the United States. The national index, Composite.10, is a composite of 10
The data set provided contains U.S. regular retail gasoline prices (cents/gallon) from 2007 to August 2017, from a national sample of gasoline stations obtained from the U.S. Department of Energy.a)
In 2016, the mean tuition of private colleges and universities was $18,230, with a standard deviation of $7272. The mean tuition for public colleges and universities was $9624, with a standard
The claims about climate change suggest two possible effects: more storms and bigger, stronger storms. Here are plots similar to those of Exercise 65, but for major hurricanes. (Data in Hurricane
The North Atlantic hurricane database, or HURDAT, is a database of all tropical storms and hurricanes for the Atlantic Ocean, Gulf of Mexico, and Caribbean Sea, reporting numbers of storms each year
The data set provided contains 2016 (4th quarter) unemployment rates for 38 developed countries (www.oecd.org). Produce an appropriate graphical display and briefly describe the distribution of
Established in Paris in 1961, the Organization for Economic Cooperation and Development (OECD) (www.oecd.org) collects information on many economic and social aspects of countries around the world.
The U.S. Energy Information Administration (EIA) collects data on the total energy used per capita in transportation for each state and the District of Columbia. The data show the per capita
On December 30, 2016, the Standard and Poor?s (S&P) 500 index hit an all-time high. During 2016, the S&P returned 12.25%. Here is a histogram of the 2016 net returns (total return ? annual
The website LosAngelesGasPrices .com has current gasoline prices all over the United States. In the week of September 10, 2017, the following histogram shows the gas prices at 44 stations in the San
Pew research surveyed 25- to 34-yearold adults in 2013 and asked them how important it is ?to you personally? to have a high-paying job? Here is a table reporting the responses. a) What percent of
In 2015, the following data were reported by the U.S. Census Bureau. The data show the number of people (in thousands) living above and below the poverty line in each of the four regions of the
The following table shows attendance data collected by the Motion Picture Association of America during the period 2014 to 2016. Figures are the number (in millions) of frequent moviegoers in each
The following table shows the number of films in each MPAA (www.mpaa.org) rating by year for each of the years between 2006 and 2015. (Data extracted from Movies 06-15) a) What percent of all these
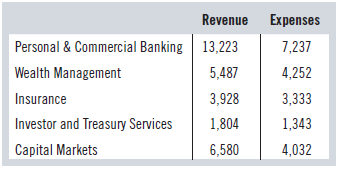
Apple, Inc., divides their expenses into four categories: Cost of Revenue; Research & Development; Selling, General, & Administrative; and Income Taxes. The table below shows these categories
The government and many companies are interested in the number of people who lose their home because they are unable to pay. The process of losing a home has three stages, which begin with a
GE derives revenue from eight operating segments, including three iconic divisions: Power, Aviation, and Healthcare. The following table shows the percentage of all revenue derived from these sources
Business-to-business sales are a huge fraction of the economy of every country. As a result, there is a whole industry dedicated to tracking the market share of business products and services.
In 2014, Pew Research Center released the results of a survey among U.S. adults that asked nearly 2000 people how satisfied they are with their current financial situation (www.pewsocialtrends
Corporations are also very interested in the value of their brand. The following chart displays the value of the top 6 carbonated soft drink brands in 2015 as collected by Millward Brown
Multinational corporations face stiff competition in the carbonated drink category (also known as soda or pop, depending on where you live). Data were collected on the 2015 U.S. market share of
The market share analysis of rides in New York City was based in part on the data from the New York City Taxi and Limousine Commission. Data on eachride can be found on the website
Determine the Pearson product?moment correlation coefficient for the following data. 3 95 3 35 6 40 95 45 38 82 90
Determine the value of r for the following data. 158 349 296 87 301 436 550 110 322 х У 510
The following data are the selling prices of houses (in $000) and the land size (in square metres) for an outer suburb of Sydney.Land size (square metres) ..................................... Price
The CEO of Combaro Ltd is interested in seeing whether employees who are paid more have a greater level of job satisfaction and take fewer days off. Using the dataset provided on the student website
The marketing team of a major car rental company has found that 68% of its customers rent a car for three days. A random sample of 500 customers is taken. What is the probability that the proportion
Showing 200 - 300
of 4120
1
2
3
4
5
6
7
8
9
10
11
12
13
14
15
Last