Below are the data used to construct the time series plots in the previous exercise. Calculate the
Question:
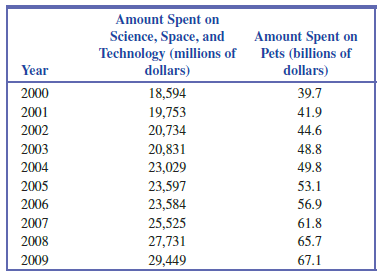
Below are the data used to construct the time series plots in the previous exercise. Calculate the value of the correlation coefficient for the amount spent on science, space, and technology and the amount spent on pets. Explain how this value is consistent with your answer to the previous exercise.
Transcribed Image Text:
Amount Spent on Science, Space, and Technology (millions of dollars) Amount Spent on Pets (billions of Year dollars) 2000 18,594 39.7 2001 19,753 20,734 20,831 23,029 41.9 2002 44.6 2003 48.8 2004 49.8 2005 23,597 23,584 53.1 2006 56.9 2007 25,525 27,731 61.8 2008 65.7 2009 29,449 67.1
Fantastic news! We've Found the answer you've been seeking!
Step by Step Answer:
Answer rating: 73% (15 reviews)
r 0975 this value is consistent with the previo...View the full answer
Answered By
JAPHETH KOGEI
Hi there. I'm here to assist you to score the highest marks on your assignments and homework. My areas of specialisation are:
Auditing, Financial Accounting, Macroeconomics, Monetary-economics, Business-administration, Advanced-accounting, Corporate Finance, Professional-accounting-ethics, Corporate governance, Financial-risk-analysis, Financial-budgeting, Corporate-social-responsibility, Statistics, Business management, logic, Critical thinking,
So, I look forward to helping you solve your academic problem.
I enjoy teaching and tutoring university and high school students. During my free time, I also read books on motivation, leadership, comedy, emotional intelligence, critical thinking, nature, human nature, innovation, persuasion, performance, negotiations, goals, power, time management, wealth, debates, sales, and finance. Additionally, I am a panellist on an FM radio program on Sunday mornings where we discuss current affairs.
I travel three times a year either to the USA, Europe and around Africa.
As a university student in the USA, I enjoyed interacting with people from different cultures and ethnic groups. Together with friends, we travelled widely in the USA and in Europe (UK, France, Denmark, Germany, Turkey, etc).
So, I look forward to tutoring you. I believe that it will be exciting to meet them.
3.00+
2+ Reviews
10+ Question Solved
Related Book For
Introduction To Statistics And Data Analysis
ISBN: 9781337793612
6th Edition
Authors: Roxy Peck, Chris Olsen, Tom Short
Question Posted:
Students also viewed these Mathematics questions
-
A computer was used to construct this dotplot below. a. How many data values are shown? b. List the values of the five smallest data. c. What is the value of the largest data item? d. What value...
-
Use the table in Example 7 to construct a time series chart for subscribers average local monthly cell phone bills for the years 2002 through 2012. Describe any trends. Table in Example 7 a. Label...
-
A student tries to construct a time-series plot to describe U.S. imports (in millions of pounds) of quinoa (see Fig. 61). The student concludes that the data points lie on a straight line. a. Explain...
-
Bookstores International, a bookstore chain, has been quite successful over the past few decades and is now in expansion mode. It typically approaches opening a new bookstore by first determining the...
-
In your own words, briefly describe the phenomenon of viscoelasticity.
-
How is actual factory overhead accounted for in a process manufacturer? AppendixLO1
-
Briefly describe the provisions of a reporting form that apply in the event the insured (a) is late in filing a report or (b) underreports the values on hand.
-
An orange grower in Florida faces a dilemma. The weather forecast is for cold weather, and there is a 50% chance that the temperature tonight will be cold enough to freeze and destroy his entire...
-
Lamp Light Limited ( LLL ) manufactures lampshades. It applies variable overhead on the basis of direct labor hours. Information from LLL ' s standard cost card follows: \ table [ [ ,...
-
Exercise 2: Implement calculate_S and calculate_R Recall that the element-wise squared Euclidean distance matrix D O DE Rnxm is defined by [D D] = (x; zj) (x; Zj) - - Also, the matrices S, RE Rnxm...
-
The amount of money spent each year on science, space, and technology in the United States (in millions of dollars) and the amount of money spent on pets in the United States (in billions of dollars)...
-
Data from the U.S. Federal Reserve Board (federalreserve.gov/releases/housedebt/, retrieved April 21, 2017) on consumer debt (as a percentage of personal income) and mortgage debt (also as a...
-
Write the first 10 terms of the Fibonacci sequence.
-
During 2022, Jason and Vicki Hurting, who are married with two children, had the following tax information. Jason owns a landscaping business, and Vicki works as a sales executive for a manufacturing...
-
Which statement about environmental theory is true? It sees health as a social issue. It is reductionistic It states that there is a specific cause for every disease. It defines solutions in terms of...
-
Tracing Data Analytics Red Flags Back to Source Documents Using Subpoenas 5-1 ANDERSON INTERNAL MEDICINE AND LARSEN CONVENIENCE STORE (CONSPIRACY AND LOAN FRAUD): TRACE TRANSACTIONS DISCOVERED DURING...
-
226 Payroll Accounting Chapter 7: Comprehensive Projects-Paper-Based Versions One-Month Project NOTE! Templates needed to complete these exercises, including one containing year-to-date payroll data,...
-
The Westchester Chamber of Commerce periodically sponsors public service seminars and programs Currently, promotional plans ore under way for this year's program Advertising alternatives include...
-
Tell whether the compounds of each pair are enantiomers, diastereomers, constitutional isomers, or not isomeric. a. b. c. d. CHO H- -OH HO- HO and H- H- HO- HO- H,OH H2OH
-
What are the four types of poultry production systems? Explain each type.
-
Taking statins raises the risk of developing diabetes. Define a population that may have been used and explain how the sample might have been selected.
-
The average January 2012 temperature in Boston was 34.2F. This was 5.2 higher than the normal January average temperature. Define a population that may have been used and explain how the sample might...
-
To check the accuracy of a machine filling coffee cups, every fifth cup is selected, and the number of ounces of coffee is measured. Identify the sampling method that was used.
-
This table shows the stock returns for Stock A and Stock B in three different scenarios. The first column shows how likely each of the three scenarios is. The risk-free rate is 5%. Calculate the...
-
The STI Desk Company manufactures student desks that it sells for $80 per unit. Current cost information is as follows: Variable Costs: Direct Material per Desk - $20 Direct Labour per Desk - $15...
-
8. Implied interest rate and period Aa Aa Consider the case of the following annuities, and the need to compute either their expected rate of return or duration Jacob needed money for some unexpected...
Study smarter with the SolutionInn App