Firstly I want to mention that this is in fact one question all together. Thank you and please understand I am trying to give you all the information regarding it. Display your R code (or however you ran the calculations) and/or additional calculations that you used for this, thank you.
Question Part A
Question Part B
Question Part C
Question Part D
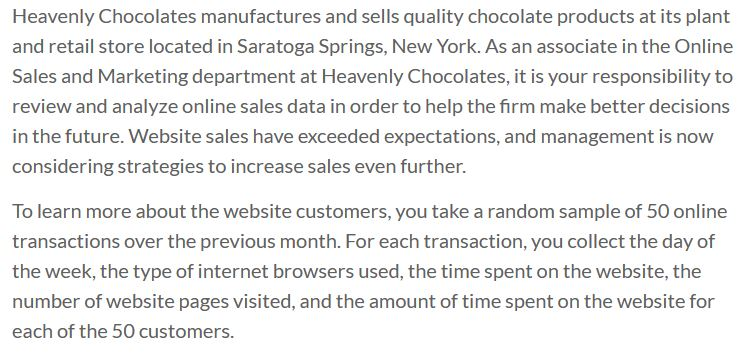
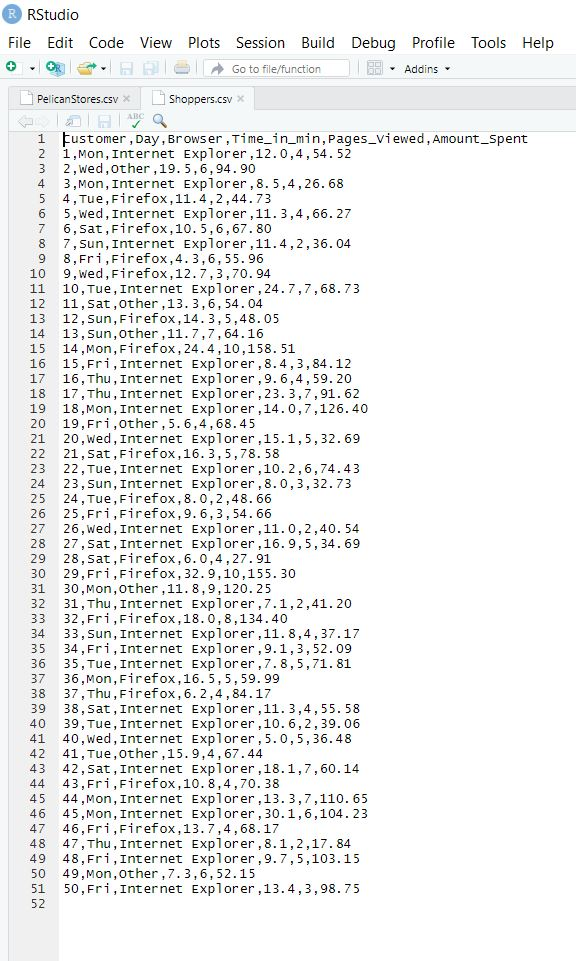
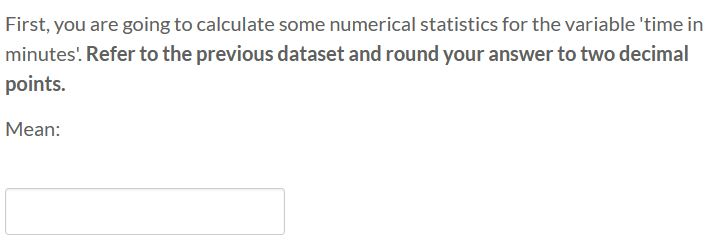
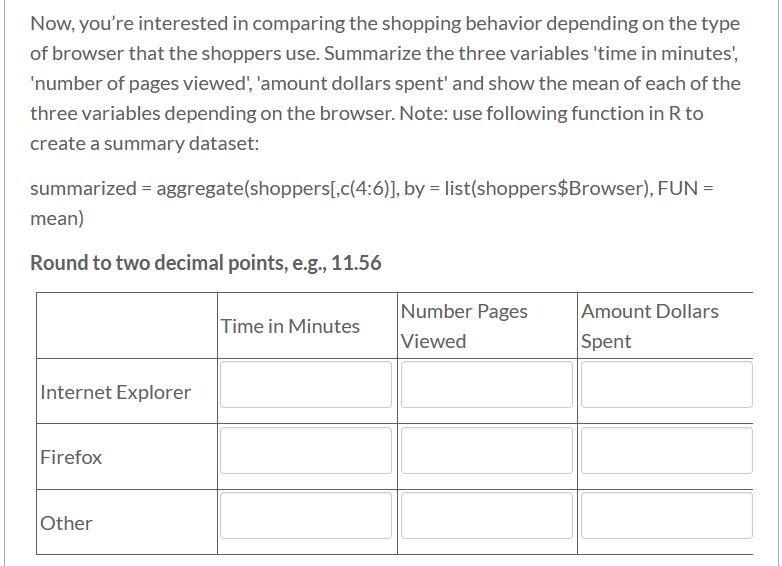
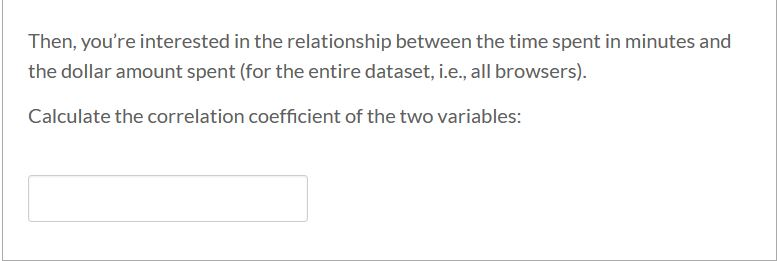
Heavenly Chocolates manufactures and sells quality chocolate products at its plant and retail store located in Saratoga Springs, New York. As an associate in the Online Sales and Marketing department at Heavenly Chocolates, it is your responsibility to review and analyze online sales data in order to help the firm make better decisions in the future. Website sales have exceeded expectations, and management is now considering strategies to increase sales even further. To learn more about the website customers, you take a random sample of 50 online transactions over the previous month. For each transaction, you collect the day of the week, the type of internet browsers used, the time spent on the website, the number of website pages visited, and the amount of time spent on the website for each of the 50 customers. RStudio File Edit Code - OR View Tools Help Plots Session Build Debug Profile G o to file/function 08 - Addins 22 21 PelicanStores.csv Shoppers.csv AQ 1 Eustomer, Day, Browser, Time_in_min, Pages_viewed, Amount_Spent 2 1,mon, Internet Explorer, 12.0,4,54.52 3 2,Wed, other, 19.5,6,94.90 3,Mon, Internet Explorer, 8.5,4,26.68 4, Tue, Firefox, 11.4,2,44.73 5,Wed, Internet Explorer, 11.3,4,66.27 7 6, Sat, Firefox, 10.5,6,67.80 8 7, Sun, Internet Explorer , 11.4,2,36.04 9 8, Fri, Firefox, 4.3,6,55.96 10 9, Wed, Firefox, 12.7,3,70.94 11 10, Tue, Internet Explorer, 24.7,7,68.73 12 11, Sat, other, 13.3,6, 54.04 13 12 , Sun, Firefox, 14.3,5,48.05 14 13, Sun, other , 11.7,7,64.16 15 14 ,Mon, Firefox, 24.4.10.158.51 16 15,Fri, Internet Explorer, 8.4,3,84.12 17 16,Thu, Internet Explorer 9. 6,4,59. 20 18 17,Thu ,Internet Explorer,23.3,7,91.62 19 18,Mon, Internet Explorer , 14.0,7,126.40 20 19, Fri,other, 5.6,4,68.45 21 20,Wed, Internet Explorer, 15.1,5, 32.69 21, Sat, Firefox, 16.3,5,78.58 23 22,Tue, Internet Explorer, 10.2,6,74.43 24 23, Sun, Internet Explorer, 8.0,3,32.73 25 24 , Tue, Firefox, 8.0,2.48.66 26 25,Fri, Firefox, 9.6,3,54.66 27 26, Wed, Internet Explorer, 11.0,2,40.54 28 27, Sat, Internet Explorer, 16. 9,5, 34.69 29 28, Sat, Firefox, 6.0,4, 27.91 30 29, Fri, Firefox, 32.9,10,155.30 31 30,Mon, other, 11.8,9,120.25 32 31,Thu, Internet Explorer.7.1,2,41. 20 33 32,Fri, Firefox, 18.0,8,134.40 34 33, Sun, Internet Explorer, 11.8,4, 37.17 35 34,Fri, Internet Explorer, 9.1, 3, 52.09 36 35,Tue, Internet Explorer, 7. 8,5,71.81 37 36,Mon, Firefox, 16.5,5, 59.99 38 37,Thu,Firefox, 6. 2,4,84.17 39 38, Sat, Internet Explorer, 11.3,4,55.58 40 39, Tue, Internet Explorer, 10.6,2,39.06 41 40, Wed, Internet Explorer, 5.0,5, 36.48 42 41,Tue, other ,15.9,4, 67.44 43 42, Sat, Internet Explorer, 18.1,7,60.14 44 43,Fri, Firefox, 10.8, 4,70.38 45 44,Mon, Internet Explorer, 13.3,7,110.65 46 45,Mon, Internet Explorer, 30.1,6,104.23 47 46, Fri, Firefox, 13.7,4,68.17 48 47, Thu,Internet Explorer,8.1,2,17. 84 49 48, Fri, Internet Explorer, 9.7,5,103.15 50 49, Mon, other ,7.3,6,52.15 51 50,Fri, Internet Explorer, 13.4,3,98.75 First, you are going to calculate some numerical statistics for the variable time in minutes. Refer to the previous dataset and round your answer to two decimal points. Mean: Refer to the previous dataset and round your answer to two decimal points. Median: Refer to the previous dataset and round your answer to two decimal points. Range: Refer to the previous dataset and round your answer to two decimal points. Standard Deviation: Now, you're interested in comparing the shopping behavior depending on the type of browser that the shoppers use. Summarize the three variables 'time in minutes', 'number of pages viewed','amount dollars spent' and show the mean of each of the three variables depending on the browser. Note: use following function in R to create a summary dataset: summarized = aggregate(shoppers[,c(4:6)], by = list(shoppers$Browser), FUN = mean) Round to two decimal points, e.g., 11.56 Time in Minutes Number Pages Viewed Amount Dollars Spent Internet Explorer Firefox Other Then, you're interested in the relationship between the time spent in minutes and the dollar amount spent (for the entire dataset, i.e., all browsers). Calculate the correlation coefficient of the two variables: Looking at the previous correlation coefficient, what does the coefficient tell you about the relationship between the two variables? Heavenly Chocolates manufactures and sells quality chocolate products at its plant and retail store located in Saratoga Springs, New York. As an associate in the Online Sales and Marketing department at Heavenly Chocolates, it is your responsibility to review and analyze online sales data in order to help the firm make better decisions in the future. Website sales have exceeded expectations, and management is now considering strategies to increase sales even further. To learn more about the website customers, you take a random sample of 50 online transactions over the previous month. For each transaction, you collect the day of the week, the type of internet browsers used, the time spent on the website, the number of website pages visited, and the amount of time spent on the website for each of the 50 customers. RStudio File Edit Code - OR View Tools Help Plots Session Build Debug Profile G o to file/function 08 - Addins 22 21 PelicanStores.csv Shoppers.csv AQ 1 Eustomer, Day, Browser, Time_in_min, Pages_viewed, Amount_Spent 2 1,mon, Internet Explorer, 12.0,4,54.52 3 2,Wed, other, 19.5,6,94.90 3,Mon, Internet Explorer, 8.5,4,26.68 4, Tue, Firefox, 11.4,2,44.73 5,Wed, Internet Explorer, 11.3,4,66.27 7 6, Sat, Firefox, 10.5,6,67.80 8 7, Sun, Internet Explorer , 11.4,2,36.04 9 8, Fri, Firefox, 4.3,6,55.96 10 9, Wed, Firefox, 12.7,3,70.94 11 10, Tue, Internet Explorer, 24.7,7,68.73 12 11, Sat, other, 13.3,6, 54.04 13 12 , Sun, Firefox, 14.3,5,48.05 14 13, Sun, other , 11.7,7,64.16 15 14 ,Mon, Firefox, 24.4.10.158.51 16 15,Fri, Internet Explorer, 8.4,3,84.12 17 16,Thu, Internet Explorer 9. 6,4,59. 20 18 17,Thu ,Internet Explorer,23.3,7,91.62 19 18,Mon, Internet Explorer , 14.0,7,126.40 20 19, Fri,other, 5.6,4,68.45 21 20,Wed, Internet Explorer, 15.1,5, 32.69 21, Sat, Firefox, 16.3,5,78.58 23 22,Tue, Internet Explorer, 10.2,6,74.43 24 23, Sun, Internet Explorer, 8.0,3,32.73 25 24 , Tue, Firefox, 8.0,2.48.66 26 25,Fri, Firefox, 9.6,3,54.66 27 26, Wed, Internet Explorer, 11.0,2,40.54 28 27, Sat, Internet Explorer, 16. 9,5, 34.69 29 28, Sat, Firefox, 6.0,4, 27.91 30 29, Fri, Firefox, 32.9,10,155.30 31 30,Mon, other, 11.8,9,120.25 32 31,Thu, Internet Explorer.7.1,2,41. 20 33 32,Fri, Firefox, 18.0,8,134.40 34 33, Sun, Internet Explorer, 11.8,4, 37.17 35 34,Fri, Internet Explorer, 9.1, 3, 52.09 36 35,Tue, Internet Explorer, 7. 8,5,71.81 37 36,Mon, Firefox, 16.5,5, 59.99 38 37,Thu,Firefox, 6. 2,4,84.17 39 38, Sat, Internet Explorer, 11.3,4,55.58 40 39, Tue, Internet Explorer, 10.6,2,39.06 41 40, Wed, Internet Explorer, 5.0,5, 36.48 42 41,Tue, other ,15.9,4, 67.44 43 42, Sat, Internet Explorer, 18.1,7,60.14 44 43,Fri, Firefox, 10.8, 4,70.38 45 44,Mon, Internet Explorer, 13.3,7,110.65 46 45,Mon, Internet Explorer, 30.1,6,104.23 47 46, Fri, Firefox, 13.7,4,68.17 48 47, Thu,Internet Explorer,8.1,2,17. 84 49 48, Fri, Internet Explorer, 9.7,5,103.15 50 49, Mon, other ,7.3,6,52.15 51 50,Fri, Internet Explorer, 13.4,3,98.75 First, you are going to calculate some numerical statistics for the variable time in minutes. Refer to the previous dataset and round your answer to two decimal points. Mean: Refer to the previous dataset and round your answer to two decimal points. Median: Refer to the previous dataset and round your answer to two decimal points. Range: Refer to the previous dataset and round your answer to two decimal points. Standard Deviation: Now, you're interested in comparing the shopping behavior depending on the type of browser that the shoppers use. Summarize the three variables 'time in minutes', 'number of pages viewed','amount dollars spent' and show the mean of each of the three variables depending on the browser. Note: use following function in R to create a summary dataset: summarized = aggregate(shoppers[,c(4:6)], by = list(shoppers$Browser), FUN = mean) Round to two decimal points, e.g., 11.56 Time in Minutes Number Pages Viewed Amount Dollars Spent Internet Explorer Firefox Other Then, you're interested in the relationship between the time spent in minutes and the dollar amount spent (for the entire dataset, i.e., all browsers). Calculate the correlation coefficient of the two variables: Looking at the previous correlation coefficient, what does the coefficient tell you about the relationship between the two variables