Drug content assessment. Scientists at GlaxoSmithKline Medicines Research Center used high-performance liquid chromatography (HPLC) to determine the
Question:
Drug content assessment. Scientists at GlaxoSmithKline Medicines Research Center used high-performance liquid chromatography (HPLC) to determine the amount of drug in a tablet produced by the company (Analytical Chemistry, Dec. 15, 2009). Drug concentrations (measured as a percentage) for 50 randomly selected tablets are listed LO8 in the accompanying table.
91.28 92.83 89.35 91.90 82.85 94.83 89.83 89.00 84.62 86.96 88.32 91.17 83.86 89.74 92.24 92.59 84.21 89.36 90.96 92.85 89.39 89.82 89.91 92.16 88.67 89.35 86.51 89.04 91.82 93.02 88.32 88.76 89.26 90.36 87.16 91.74 86.12 92.10 83.33 87.61 88.20 92.78 86.35 93.84 91.20 93.44 86.77 83.77 93.19 81.79 Based on Borman, P. J., et al., “Design and analysis of method equivalence studies.”
Analytical Chemistry, Vol. 81, No. 24, Dec. 15, 2009 (Table 3).
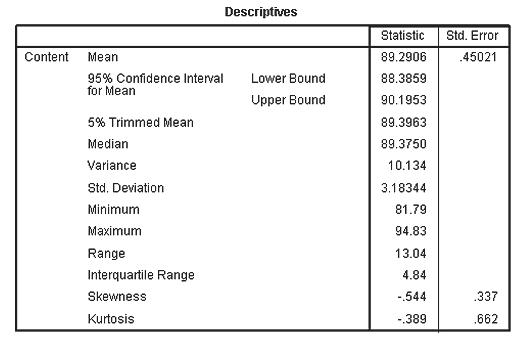
a. Descriptive statistics for the drug concentrations are shown at the top of the following SPSS printout on p. 288.


Use this information to assess whether the data are approximately normal.
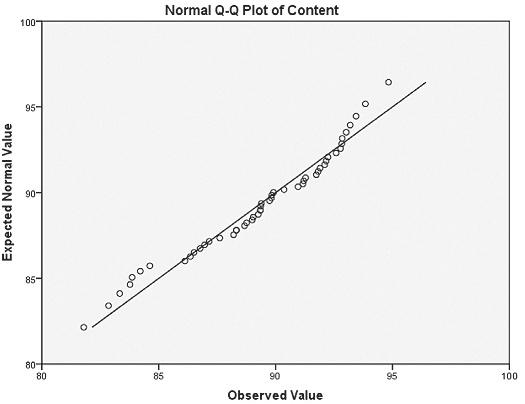
b. An SPSS normal probability plot is shown above. Use this information to assess whether the data are approximately normal.
Step by Step Answer:


