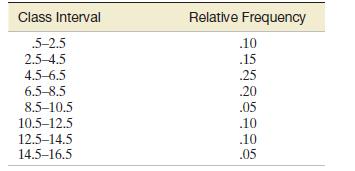
Graph the relative frequency histogram for the 500 measurements summarized in the accompanying relative frequency table. Class
Question:
Graph the relative frequency histogram for the 500 measurements summarized in the accompanying relative frequency table. 
Step by Step Answer:
Related Book For 

Statistics Plus New Mylab Statistics With Pearson Etext Access Card Package
ISBN: 978-0134090436
13th Edition
Authors: James Mcclave ,Terry Sincich
Question Posted:


