

Graph the situation. Label and scale the horizontal axis. Mark the mean and test statistic. Shade in
Question:
Graph the situation. Label and scale the horizontal axis. Mark the mean and test statistic. Shade in the region corresponding to the confidence level.

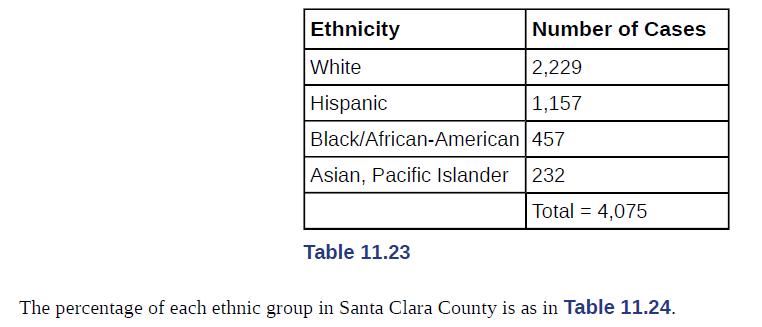
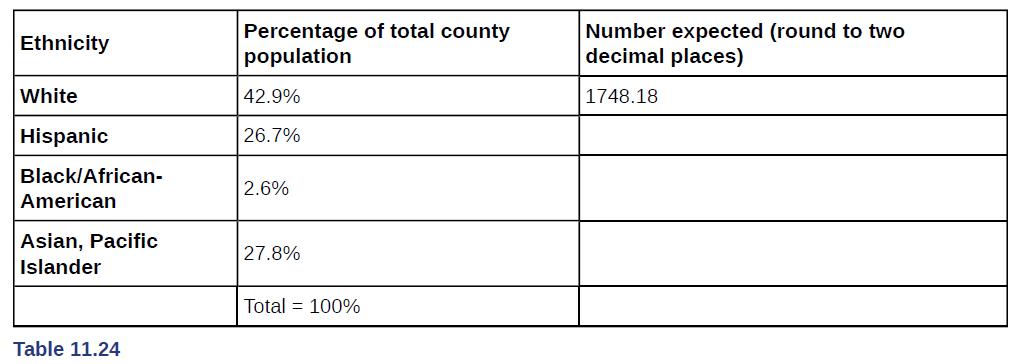
Let α = 0.05 Decision: ________________ Reason for the Decision: ________________ Conclusion (write out in complete sentences): ________________ The following data are real. The cumulative number of AIDS cases reported for Santa Clara County is broken down by ethnicity as in Table 11.23.
Fantastic news! We've Found the answer you've been seeking!
Step by Step Answer:
Graph Check students solution Decision Cannot accept the null hyp...View the full answer

Answered By
User l_1121157
After my university education, I joined a high school to teach as a volunteer, and even during the university education, teaching practice is part and parcel of the academic journey. Therefore I have been handling all grades from grade 9-12. I have been handling a candidate class, hence boldly helping me gain some experience, in my line of profession. Today I stand as a qualified Geography and Business teacher, with some academic awards towards my subject of specialisation. Thank you.
0 Reviews
10+ Question Solved
Related Book For 
Introductory Business Statistics
ISBN: 202318
1st Edition
Authors: Alexander Holmes , Barbara Illowsky , Susan Dean
Question Posted:
