

Independent random samples were selected from each of two normally distributed populations, n1 = 16 from population
Question:
Independent random samples were selected from each of two normally distributed populations, n1 = 16 from population 1 and n2 = 25 from population 2. The means and variances for the two samples are shown in the following table.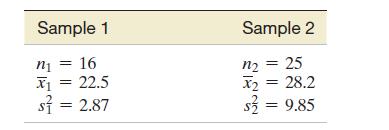
a. Test the null hypothesis H0: s1 2 = s2 2 against the alternative hypothesis Ha: s1 2 s2 2 . Use a = .05.
b. Find and interpret the p-value of the test.
Fantastic news! We've Found the answer you've been seeking!
Step by Step Answer:

Answered By
ANDREW KIPRUTO
Academic Writing Expert
I have over 7 years of research and application experience. I am trained and licensed to provide expertise in IT information, computer sciences related topics and other units like chemistry, Business, law, biology, biochemistry, and genetics. I'm a network and IT admin with +8 years of experience in all kind of environments.
I can help you in the following areas:
Networking
- Ethernet, Wireless Airmax and 802.11, fiber networks on GPON/GEPON and WDM
- Protocols and IP Services: VLANs, LACP, ACLs, VPNs, OSPF, BGP, RADIUS, PPPoE, DNS, Proxies, SNMP
- Vendors: MikroTik, Ubiquiti, Cisco, Juniper, HP, Dell, DrayTek, SMC, Zyxel, Furukawa Electric, and many more
- Monitoring Systems: PRTG, Zabbix, Whatsup Gold, TheDude, RRDtoo
Always available for new projects! Contact me for any inquiries
1+ Reviews
10+ Question Solved
Related Book For 

Statistics Plus New Mylab Statistics With Pearson Etext Access Card Package
ISBN: 978-0134090436
13th Edition
Authors: James Mcclave ,Terry Sincich
Question Posted:
