

Refer to Exercise 11.18. After the least square line has been obtained, the following table can be
Question:
Refer to Exercise 11.18. After the least square line has been obtained, the following table can be used (1) to compare the observed and predicted values of y and (2) to compute SSE.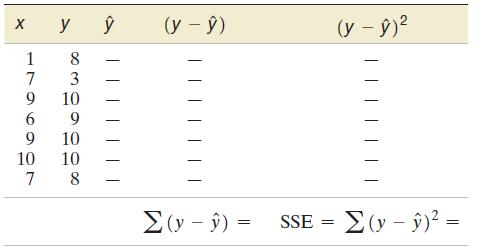
a. Complete the table.
b. Plot the least squares line on a scatterplot of the data.
Plot the following line on the same graph:
yn = 8.20 - .45x
c. Show that SSE is larger for the line in part b than it is for the least squares line.
Step by Step Answer:

This question has not been answered yet.
You can Ask your question!
Related Book For 

Statistics Plus New Mylab Statistics With Pearson Etext Access Card Package
ISBN: 978-0134090436
13th Edition
Authors: James Mcclave ,Terry Sincich
Question Posted:
