

State SAT scores. Educators are constantly evaluating the efficacy of public schools in the education and training
Question:
State SAT scores. Educators are constantly evaluating the efficacy of public schools in the education and training of U.S. students. One quantitative assessment of change over time is the difference in scores on the SAT, which has been used for decades by colleges and universities as one criterion for admission. The SAT file contains average SAT scores for each of the 50 states and the District of Columbia for 2011 and 2014. Selected observations are shown in the following table: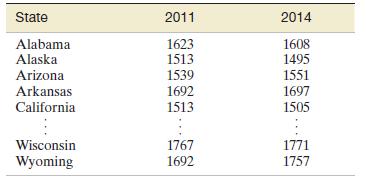
a. Use graphs to display the two SAT score distributions.
How have the distributions of state scores changed from 2011 to 2014?
b. As another method of comparing the 2011 and 2014 average SAT scores, compute the paired difference by subtracting the 2011 score from the 2014 score for each state. Summarize these differences with a graph.
c. Interpret the graph you made in part
b. How do your conclusions compare with those of part a?
d. Identify the state with the largest improvement in the SAT score between 2011 and 2014.
Step by Step Answer:

This question has not been answered yet.
You can Ask your question!


Statistics Plus New Mylab Statistics With Pearson Etext Access Card Package
ISBN: 978-0134090436
13th Edition
Authors: James Mcclave ,Terry Sincich
