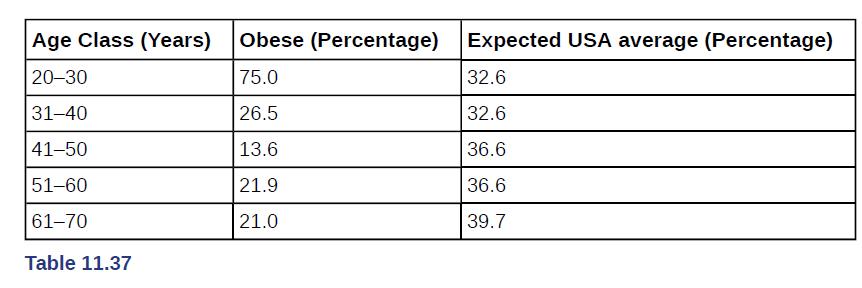
Table 11.37 contains information from a survey among 499 participants classified according to their age groups. The
Question:
Table 11.37 contains information from a survey among 499 participants classified according to their age groups. The second column shows the percentage of obese people per age class among the study participants. The last column comes from a different study at the national level that shows the corresponding percentages of obese people in the same age classes in the USA. Perform a hypothesis test at the 5% significance level to determine whether the survey participants are a representative sample of the USA obese population.

Fantastic news! We've Found the answer you've been seeking!
Step by Step Answer:
Related Book For 

Introductory Business Statistics
ISBN: 202318
1st Edition
Authors: Alexander Holmes , Barbara Illowsky , Susan Dean
Question Posted:


