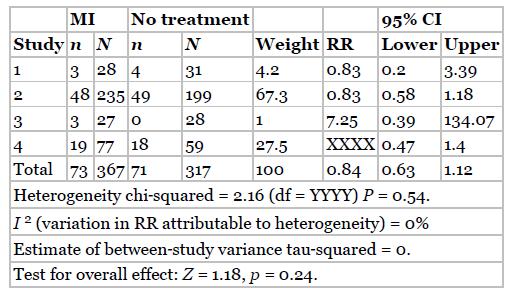
Table 18.3 reports that the overall or pooled 95% CI for the RR across the four trials
Question:
Table 18.3 reports that the overall or pooled 95% CI for the RR across the four trials for stopping smoking in the MI group compared to the no treatment control group is 0.63 to 1.12.
Which, if any, of the following statements is CORRECT?
A. The above 95% CI definitely contains the true population RR for stopping smoking in the MI group compared to the no treatment control group.
B. The 95% CI is calculated as ±3 standard errors away from the mean difference.
C. There is a probability of 0.95 that the population RR for stopping smoking in the MI group compared to the no treatment control group lies between 0.63 and 1.12.
D. The 95% CI does not contain the true population RR for stopping smoking in the MI group compared to the no treatment control group.
E. The above 95% CI is likely to contain the true population RR for stopping smoking in the MI group compared to the no treatment control group.
Table 18.3

Step by Step Answer:

Medical Statistics A Textbook For The Health Sciences
ISBN: 9781119423645
5th Edition
Authors: Stephen J. Walters, Michael J. Campbell, David Machin


