

Table 2.80 gives the percent of children under five considered to be underweight. What is the best
Question:
Table 2.80 gives the percent of children under five considered to be underweight.
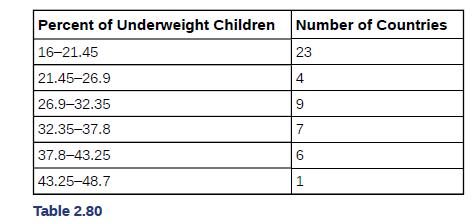
What is the best estimate for the mean percentage of underweight children? What is the standard deviation? Which interval(s) could be considered unusual? Explain.
Fantastic news! We've Found the answer you've been seeking!
Step by Step Answer:

Answered By
Joseph Njoroge
I am a professional tutor with more than six years of experience. I have helped thousands of students to achieve their academic goals. My primary objectives as a tutor is to ensure that students do not have problems while tackling their academic problems.
10+ Reviews
27+ Question Solved
Related Book For 
Introductory Business Statistics
ISBN: 202318
1st Edition
Authors: Alexander Holmes , Barbara Illowsky , Susan Dean
Question Posted:
