

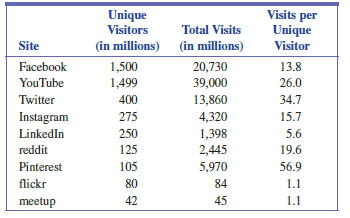
The accompanying table gives the total number visits and the number of unique visitors for some popular social networking sites in the United States for
The accompanying table gives the total number visits and the number of unique visitors for some popular social networking sites in the United States for the month of July 2017. The number of unique visitors data are taken from the online article ?Top 15 Most Popular Social Networking Sites? (ism .org/images/files/Social-media-platforms-from -Engage-to-Succeed-webinar.pdf, retrieved February 7, 2018). The total number of visits were estimated using data from semrush.com (retrieved February 7, 2018). The data on total visits and unique visitors were used to compute the values in the final column of the data table, in which visits per unique visitor = total visits / number of unique visitors
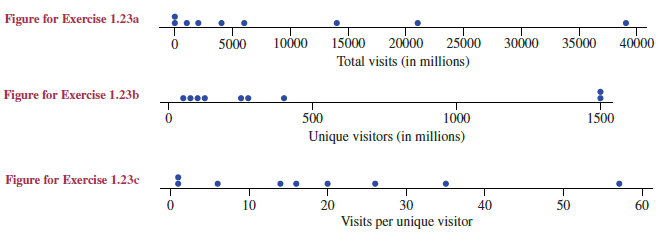
a. A dotplot of the total visits data is shown at the top of the page. What are the most obvious features of the dotplot? What does it tell you about the online social networking sites?
b. A dotplot for the number of unique visitors is shown at the top of the page. In what way is this dotplot different from the dotplot for total visits in Part (a)? What does this tell you about the online social networking sites?
c. A dotplot for the visits per unique visitor data is shown at the top of the page. What new information about the online social networks is provided by this dotplot?
Unique Visitors Visits per Unique Total Visits Site (in millions) (in millions) Visitor Facebook 1,500 1,499 20,730 39,000 13.8 YouTube 26.0 Twitter Instagram 400 13,860 34.7 275 4,320 15.7 LinkedIn 250 1,398 2,445 5.6 reddit 125 19.6 Pinterest 105 5,970 56.9 flickr 80 84 1.1 meetup 45 1.1 Figure for Exercise 1.23a 15000 20000 25000 30000 35000 40000 5000 10000 Total visits (in millions) Figure for Exercise 1.23b 1000 1500 500 Unique visitors (in millions) Figure for Exercise 1.23c 30 Visits per unique visitor 10 20 40 50 60
Step by Step Solution
3.23 Rating (158 Votes )
There are 3 Steps involved in it
Step: 1
a The dotplot shows that there were three sites that received far greater numbers of visits than the ... View full answer

Get step-by-step solutions from verified subject matter experts
100% Satisfaction Guaranteed-or Get a Refund!
Step: 2Unlock detailed examples and clear explanations to master concepts

Step: 3Unlock to practice, ask and learn with real-world examples
See step-by-step solutions with expert insights and AI powered tools for academic success
-
 Access 30 Million+ textbook solutions.
-
Ask unlimited questions from AI Tutors.
-
Order free textbooks.
-
100% Satisfaction Guaranteed-or Get a Refund!
Claim Your Hoodie Now!

Authors: Roxy Peck, Chris Olsen, Tom Short
6th Edition
1337793612, 978-1337793612

Study Smart with AI Flashcards
Access a vast library of flashcards, create your own, and experience a game-changing transformation in how you learn and retain knowledge
Explore Flashcards

