

Question: The following data represent the seat capacity for major airlines on an annual basis: a. Construct a bar graph representing the seat capacity of the
The following data represent the seat capacity for major airlines on an annual basis:
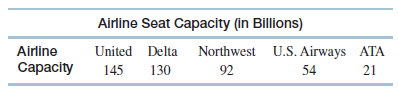
a. Construct a bar graph representing the seat capacity of the major airlines for the five airlines indicated.
b. Produce a pie chart exhibiting the percentage of the total seat capacity for the five major airlines.
Airline Seat Capacity (in Billions) Airline United Delta Northwest U.S. Airways ATA 130 54 21 Capacity 145 92
Step by Step Solution
★★★★★
3.52 Rating (165 Votes )
There are 3 Steps involved in it
1 Expert Approved Answer
Step: 1 Unlock

a The bar graph is b The percent equals the individual ca... View full answer
Question Has Been Solved by an Expert!
Get step-by-step solutions from verified subject matter experts
Step: 2 Unlock
Step: 3 Unlock
Document Format (2 attachments)
1609_606321ef4b60c_679677.pdf
180 KBs PDF File
1609_606321ef4b60c_679677.docx
120 KBs Word File