

Question: These data compare the on-time arrival performance of American and US Airways shortly before their merger in 2015. The table shows the status of 9,350
These data compare the on-time arrival performance of American and US Airways shortly before their merger in 2015. The table shows the status of 9,350 arrivals during January 2015.
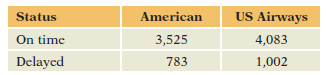
(a) On the basis of this initial summary, find the percentages (row or column) that are appropriate for comparing the on-time arrival rates of the two airlines. Which arrives on time more often?
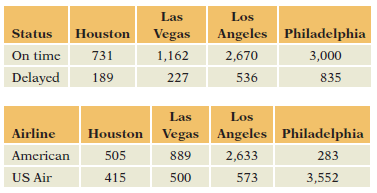
(b) The next two tables organize these same flights by destination. The first also shows arrival time and the second shows airline. Does it appear that a lurking variable might be at work here? How can you tell?
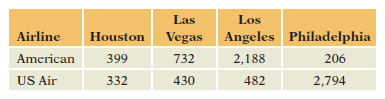
(c) Each cell of the following table shows the number of on-time arrivals for each airline at each destination. Is Destination a lurking factor behind the original 2 * 2 table?
Status American US Airways 4,083 1,002 3,525 On time Delayed 783 Las Los s Status Houston Vegas Angeles Philadelphia On time 731 1,162 2,670 3,000 Delayed 189 227 536 835 Las Los Airline Houston Vegas Angeles Philadelphia American 505 889 2,633 283 US Air 415 500 573 3,552
Step by Step Solution
3.44 Rating (163 Votes )
There are 3 Steps involved in it
a Use the column percentages American is doing better its ... View full answer

Get step-by-step solutions from verified subject matter experts