

Question: A machine part was tested by bending it x centimeters 10 times per minute until the time (in hours) of failure. The results are recorded
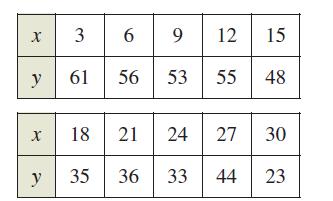
A machine part was tested by bending it x centimeters 10 times per minute until the time (in hours) of failure. The results are recorded in the table.
(a) Use the regression capabilities of a graphing utility to find a linear model for the data.
(b) Use a graphing utility to plot the data and graph the model.
(c) Use the graph to determine whether there may have been an error made in conducting one of the tests or in recording the results. If so, eliminate the erroneous point and find the model for the remaining data.
x y X y 369 9 61 12 15 56 53 55 48 18 21 24 27 35 36 33 44 30 23
Step by Step Solution
3.33 Rating (162 Votes )
There are 3 Steps involved in it
a b ... View full answer

Get step-by-step solutions from verified subject matter experts