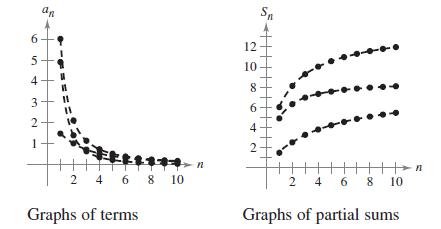
The figures show the graphs of the first 10 terms, and the graphs of the first 10
Question:
The figures show the graphs of the first 10 terms, and the graphs of the first 10 terms of the sequence of partial sums, of each series.
(a) Identify the series in each figure.
(b) Which series is a p-series? Does it converge or diverge?
(c) For the series that are not p-series, how do the magnitudes of the terms compare with the magnitudes of the terms of the p-series? What conclusion can you draw about the convergence or divergence of the series?
(d) Explain the relationship between the magnitudes of the
terms of the series and the magnitudes of the terms of the
partial sums.

Fantastic news! We've Found the answer you've been seeking!
Step by Step Answer:
Related Book For 

Question Posted:


