All Matches
Solution Library
Expert Answer
Textbooks
Search Textbook questions, tutors and Books
Oops, something went wrong!
Change your search query and then try again
Toggle navigation
FREE Trial
S
Books
FREE
Tutors
Study Help
Expert Questions
Accounting
General Management
Mathematics
Finance
Organizational Behaviour
Law
Physics
Operating System
Management Leadership
Sociology
Programming
Marketing
Database
Computer Network
Economics
Textbooks Solutions
Accounting
Managerial Accounting
Management Leadership
Cost Accounting
Statistics
Business Law
Corporate Finance
Finance
Economics
Auditing
Hire a Tutor
AI Study Help
New
Search
Search
Sign In
Register
study help
mathematics
calculus 10th edition
Questions and Answers of
Calculus 10th Edition
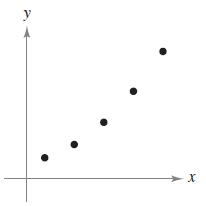
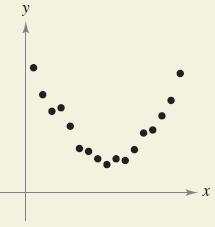
Describe a possible real-life situation for each data set. Then describe how a model could be used in the real-life setting. y ● X
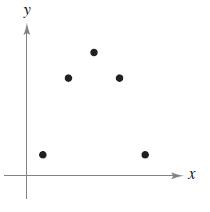
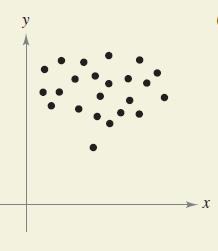
Describe a possible real-life situation for each data set. Then describe how a model could be used in the real-life setting. ● -X
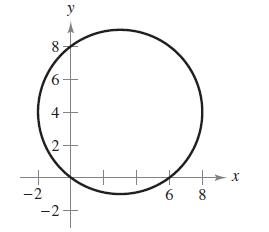
Consider the circleas shown in the figure.(a) Find the center and radius of the circle.(b) Find an equation of the tangent line to the circle at the point (0, 0).(c) Find an equation of the tangent
Match the equation with its graph. [The graphs are labeled (a), (b), (c), and (d).](a)(b)(c)(d)y = √9 - x² -1 2 y 1
Each ordered pair gives the average weekly wage x for federal government workers and the average weekly wage y for state government workers for 2001 through 2009.(a) Plot the data. From the graph, do
The Heaviside function H(x) is widely used in engineering applications.Sketch the graph of the Heaviside function and the graphs of the following functions by hand.(a) H(x) - 2(b) H(x - 2)(c) -
Find any intercepts.y = 5x - 8
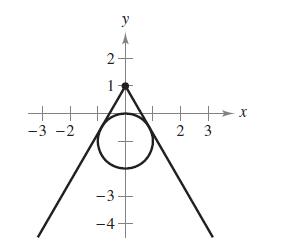
There are two tangent lines from the point (0, 1) to the circle x² + (y + 1)2 = 1 (see figure). Find equations of these two lines by using the fact that each tangent line intersects the circle at
Find any intercepts. y x - 3 x - 4
The ordered pairs represent the scores on two consecutive 15-point quizzes for a class of 15 students.(a) Plot the data. From the graph, does the relationship between consecutive scores appear to be
In an experiment, students measured the speed s (in meters per second) of a falling object t seconds after it was released. The results are shown in the table.(a) Use the regression capabilities of a
Hooke's Law states that the force F required to compress or stretch a spring (within its elastic limits) is proportional to the distance d that the spring is compressed or stretched from its original
Find any intercepts.y = x² - 8x + 12
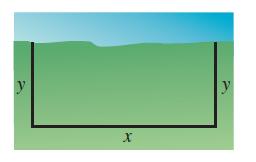
Maximum Area A rancher plans to fence a rectangular pasture adjacent to a river. The rancher has 100 meters of fencing, and no fencing is needed along the river (see figure).(a) Write the area A of
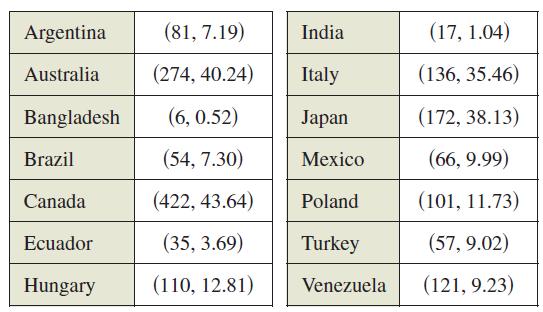
The data show the per capita energy consumptions (in millions of Btu) and the per capita gross national incomes (in thousands of U.S. dollars) for several countries in 2008.(a) Use the regression
Find any intercepts.y = (x − 3) √x + 4
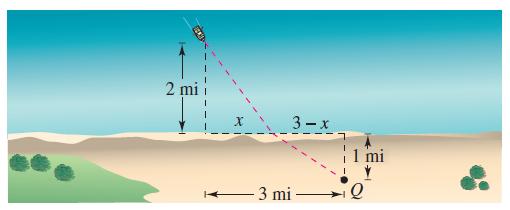
You are in a boat 2 miles from the nearest point on the coast. You are to go to a point Q located 3 miles down the coast and 1 mile inland (see figure). You can row at 2 miles per hour and walk at 4
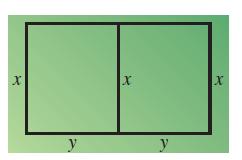
Maximum Area A rancher has 300 feet of fencing to enclose two adjacent pastures (see figure).(a) Write the total area A of the two pastures as a function of x. What is the domain of A?(b) Graph the
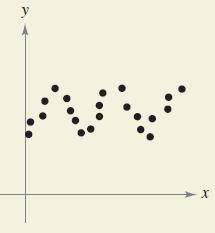
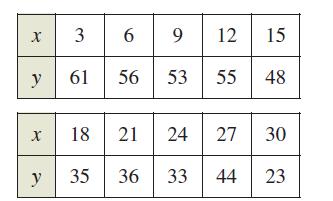
Determine whether the data can be modeled by a linear function, a quadratic function, or a trigonometric function, or that there appears to be no relationship between x and y.(a)(b)(c)(d) y X
Test for symmetry with respect to each axis and to the origin.y = x² + 4x
Test for symmetry with respect to each axis and to the origin.y = x4 - x² + 3
Test for symmetry with respect to each axis and to the origin.y2 = x² - 5
Sketch the graph of the equation. Identify any intercepts and test for symmetry. y = -x + 3
A V8 car engine is coupled to a dynamometer, and the horsepower y is measured at different engine speeds x (in thousands of revolutions per minute). The results are shown in the table.(a) Use the
You drive to the beach at a rate of 120 kilometers per hour. On the return trip, you drive at a rate of 60 kilometers per hour. What is your average speed for the entire trip? Explain your reasoning.
Let(a) What are the domain and range of ƒ?(b) Find the composition ƒ(ƒ(x)). What is the domain of this function?(c) Find ƒ(ƒ(ƒ(x))). What is the domain of this function?(d) Graph ƒ(ƒ(ƒ(x))).
Test for symmetry with respect to each axis and to the origin.xy = -2
Explain how you would graph the equationThen sketch the graph. y + y = x + |x|.
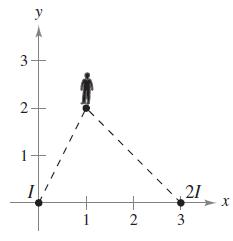
Sound Intensity A large room contains two speakers that are 3 meters apart. The sound intensity I of one speaker is twice that of the other, as shown in the figure. (To print an enlarged copy of the
Sketch the graph of the equation. Identify any intercepts and test for symmetry.y = -x² + 4
Sketch the graph of the equation. Identify any intercepts and test for symmetry.y = x³ - 4x
Find the points of intersection of the graphs of the equations. 5x + 3y = -1 x - y = -5 ||
Find the points of intersection of the graphs of the equations. 2x + 4y = 9 6x - 4y = 7
Sketch the graph of the equation. Identify any intercepts and test for symmetry.y² = 9 - x
Let d1 and d2 be the distances from the point (x, y) to the points (-1, 0) and (1, 0), respectively, as shown in the figure. Show that the equation of the graph of all points (x, y) satisfying d1d₂
Sketch the graph of the equation. Identify any intercepts and test for symmetry.y = 2√4 - x
Suppose the speakers in Exercise 13 are 4 meters apart and the sound intensity of one speaker is k times that of the other, as shown in the figure.(a) Find the equation of all locations (x, y) where
Sketch the graph of the equation. Identify any intercepts and test for symmetry.y = |x - 4| - 4
For i = 1, 2, let Ti be a triangle with side lengths ai, bi, ci,and area Ai. Suppose that a1, ≤ a2, b₁ ≤ b₂, C₁ ≤ c₂, andthat T₂ is an acute triangle. Does it follow that A1 ≤ A₂?
Find the points of intersection of the graphs of the equations. x - y = -5 x² - y = 1
Find the points of intersection of the graphs of the equations. I = A + X- - 1 1 = x² + y
Find an equation of the line that passes through the point and has the indicated slope. Then sketch the line. Point (3,-5) Slope 7 4 m
Plot the points and find the slope of the line passing through them. (2, 1), (5,2)
Find an equation of the line that passes through the point and has the indicated slope. Then sketch the line. Point (-8, 1) Slope m is undefined.
Find an equation of the line that passes through the point and has the indicated slope. Then sketch the line. Point (5, 4) Slope 0 = u m = 0
Find an equation of the line that passes through the point and has the indicated slope. Then sketch the line. Point Slope (-3,0) m = ⇨
Plot the points and find the slope of the line passing through them.(-7, 8), (-1, 8)
Use the slope and -intercept to sketch a graph of the equation.y = 6
Use the slope and -intercept to sketch a graph of the equation. x = - 3
Use the slope and -intercept to sketch a graph of the equation.y = 4x - 2
Use the slope and -intercept to sketch a graph of the equation.3x + 2y = 12
Find an equation of the line that passes through the points. Then sketch the line.(0, 0), (8, 2)
Evaluate the function at the given value(s) of the independent variable. Simplify the result. f(x) = 4x2 f(x + Δx) = f(x) · Δε
Find an equation of the line that passes through the points. Then sketch the line.(-5, 5), (10, -1)
Find equations of the lines passing through (-3, 5) and having the following characteristics.(a) Slope of 7/16(b) Parallel to the line 5x - 3y = 3(c) Perpendicular to the line 3x + 4y = 8(d) Parallel
Find equations of the lines passing through (2, 4) and having the following characteristics.(a) Slope of -2/3(b) Perpendicular to the line x + y = 0(c) Passing through the point (6, 1)(d) Parallel to
Evaluate the function at the given value(s) of the independent variable. Simplify the result. f(x) = 2x - 6 f(x) = f(-1) x - 1
The purchase price of a new machine is $12,500, and its value will decrease by $850 per year. Use this information to write a linear equation that gives the value V of the machine t years after it is
Break-Even Analysis A contractor purchases a piece of equipment for $36,500 that costs an average of $9.25 per hour for fuel and maintenance. The equipment operator is paid $13.50 per hour, and
Evaluate the function at the given value(s) of the independent variable. Simplify the result.ƒ(x) = x³ - 2x(a) ƒ(-3)(b) ƒ(2)(c) ƒ(-1)(d) ƒ(c − 1)
Find the domain and range of the function. h(x) 2 x + 1
Find the domain and range of the function.ƒ(x) = x² + 3
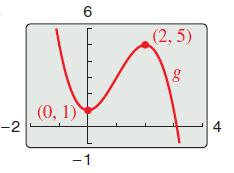
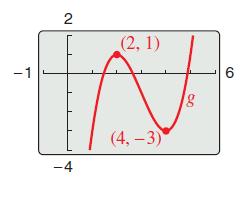
Use a graphing utility to graph ƒ(x) = x³ -3x². Use the graph to write a formula for the function g shown in the figure.(a)(b) -2 (0, 1) 6 -1 (2,5) co 8 4
Find the domain and range of the function.g(x) = √6 - x
Sketch the graph of the equation and use the Vertical Line Test to determine whether is a function of x. У = x - 2 x - 2 X
Find the domain and range of the function.ƒ(x) = -|x + 1|
Sketch the graph of the equation and use the Vertical Line Test to determine whether is a function of x.x - y² = 6
(a) Use a graphing utility to graph the functions ƒ, g, and h in the same viewing window. Write a description of any similarities and differences you observe among the graphs.(b) Use the result in
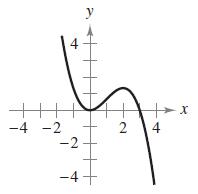
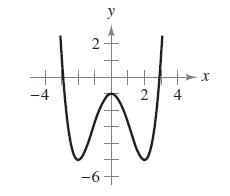
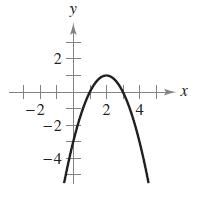
What is the minimum degree of the polynomial function whose graph approximates the given graph? What sign must the leading coefficient have?(a)(b)(c)(d) -4 -2 -2 -4 y 2 4 -X
Sketch the graph of the equation and use the Vertical Line Test to determine whether is a function of x.x² - y = 0
Use the results of Exercise 48 To guess theshapes of the graphs of the functions ƒ, g, and h. Then use agraphing utility to graph each function and compare the resultwith your guess.(a) ƒ(x) =
Sketch the graph of the equation and use the Vertical Line Test to determine whether is a function of x.x = 9 - y²
A machine part was tested by bending it x centimeters 10 times per minute until the time (in hours) of failure. The results are recorded in the table.(a) Use the regression capabilities of a graphing
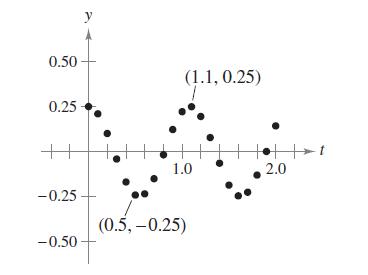
The motion of an oscillating weight suspended by a spring was measured by a motion detector. The data collected and the approximate maximum (positive and negative) displacements from equilibrium are
The data in the table show the median income y(in thousands of dollars) for males of various ages x in the United States in 2009.(a) Use the regression capabilities of a graphing utility to find a
Determine whether y is a function of x.y² = x² - 1
Sketch a graph of the function and find its domain and range. Use a graphing utility to verify your graph. h(x) || √x-6
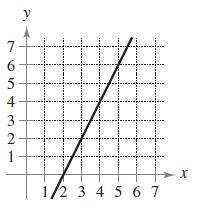
Estimate the slope of the line from its graph. 76543 C 2 y 1/2 3 4 5 6 7 X
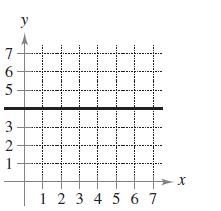
Estimate the slope of the line from its graph. 765 6 y 3. 2 1 1 2 3 4 5 6 7 X
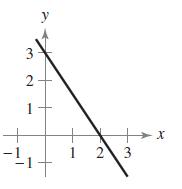
Match the equation with its graph. [The graphs are labeled (a), (b), (c), and (d).](a)(b)(c)(d)y = -3/2x + 3 -1 2 y 1
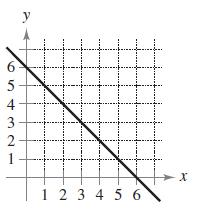
Estimate the slope of the line from its graph. NWр са 5 4 3 2 1 y 1 2 3 4 5 6 X
State the Divergence Theorem.
A stone weighing 1 pound is attached to the end of a two-foot string and is whirled horizontally with one end held fixed. It makes 1 revolution per second. Find the work done by the force that keeps
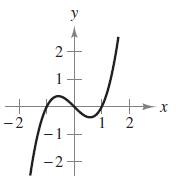
Match the equation with its graph. [The graphs are labeled (a), (b), (c), and (d).](a)(b)(c)(d)y = x³ - x -1 2 y 1
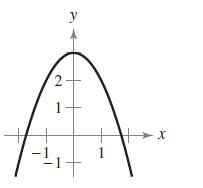
Match the equation with its graph. [The graphs are labeled (a), (b), (c), and (d).](a)(b)(c)(d)y = 3 - x² -1 2 y 1
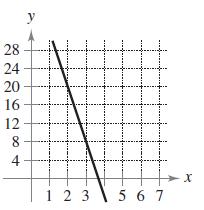
Estimate the slope of the line from its graph. 28 24 20 16 12 8 4 A co y FI 123 567 -X
Evaluate the function at the given value(s) of the independent variable. Simplify the results.ƒ(x) = 7x - 4(a) ƒ(0)(b) ƒ(-3)(c) ƒ(b)(d) ƒ(x - 1)
Evaluate the function at the given value(s) of the independent variable. Simplify the results.ƒ(x) = √x + 5 (a) ƒ(- 4)(b) ƒ(11)(c) ƒ(4)(d) ƒ(x + Δx)
Evaluate the function at the given value(s) of the independent variable. Simplify the results.g(x) = 5 - x²(a) g(0)(b) g(√5)(c) g(-2)(d) g(t - 1)
Evaluate the function at the given value(s) of the independent variable. Simplify the results.g(x) = x²(x - 4)(a) g(4)(b) g(3/2)(c) g(c)(d) g(t + 4)
Evaluate the function at the given value(s) of the independent variable. Simplify the results. f(x) = x3 f(x + Δx) = f(x) Δε
Sketch the graph of the equation by point plotting.y = 1/2x + 2
Plot the pair of points and find the slope of the line passing throughthem.(3, -4), (5, 2)
Evaluate the function at the given value(s) of the independent variable. Simplify the results.ƒ(x)= cos 2x(a) ƒ(0)(b) ƒ(- π/4) (c) ƒ(π/3) (d) ƒ(π)
Sketch the graph of the equation by point plotting.y = 5 - 2x
Plot the pair of points and find the slope of the line passing throughthem.(1, 1), (-2, 7)
Plot the pair of points and find the slope of the line passing throughthem. 31 (-1, 3), (-1, 1)
Evaluate the function at the given value(s) of the independent variable. Simplify the results.ƒ(x) = sinx(a) ƒ(π) (b) ƒ(5π/4) (c) ƒ(2π/3)(d) ƒ( - π/6)
Sketch the graph of the equation by point plotting.y = 4 - x²
Evaluate the function at the given value(s) of the independent variable. Simplify the results. f(x) = 3x - 1 f(x) = f(1) x-1
Showing 1 - 100
of 9871
1
2
3
4
5
6
7
8
9
10
11
12
13
14
15
Last