All Matches
Solution Library
Expert Answer
Textbooks
Search Textbook questions, tutors and Books
Oops, something went wrong!
Change your search query and then try again
Toggle navigation
FREE Trial
S
Books
FREE
Tutors
Study Help
Expert Questions
Accounting
General Management
Mathematics
Finance
Organizational Behaviour
Law
Physics
Operating System
Management Leadership
Sociology
Programming
Marketing
Database
Computer Network
Economics
Textbooks Solutions
Accounting
Managerial Accounting
Management Leadership
Cost Accounting
Statistics
Business Law
Corporate Finance
Finance
Economics
Auditing
Hire a Tutor
AI Study Help
New
Search
Search
Sign In
Register
study help
mathematics
calculus 10th edition
Questions and Answers of
Calculus 10th Edition
Plot the pair of points and find the slope of the line passing throughthem.(4, 6), (4, 1)
Evaluate the function at the given value(s) of the independent variable. Simplify the results. 1 x-1 f(x) = f(x) = f(2) x-2
Sketch the graph of the equation by point plotting.y = (x - 3)²
Plot the pair of points and find the slope of the line passing throughthem.(3, -5), (5, -5)
Plot the pair of points and find the slope of the line passing throughthem. (3, 3), (4, -1)
Sketch the lines through the point with the indicated slopes. Make the sketches on the same set of coordinate axes. Point (3, 4) Slopes (a) 1 (b) -2 (c) (d) Undefined
Evaluate the function at the given value(s) of the independent variable. Simplify the results. f(x) = x³ = x f(x) - ƒ(1) x 1
Sketch the graph of the equation by point plotting.y = |x + 2|
Sketch the graph of the equation by point plotting.y = |x| - 1
Use the point on the line and the slope of the line to find three additional points that the line passes through. (There is more than one correct answer.) Point (6,2) Slope m = 0
Sketch the lines through the point with the indicated slopes. Make the sketches on the same set of coordinate axes. Point (-2,5) Slopes (a) 3 (b) -3 (c) 3 (d) 0
Find the domain and range of the function.ƒ(x) = 4x²
Sketch the graph of the equation by point plotting.y = √x - 6
Sketch the graph of the equation by point plotting. y 1 x + 2
Sketch the graph of the equation by point plotting. y 3 X
Use the point on the line and the slope of the line to find three additional points that the line passes through. (There is more than one correct answer.) Point (-4, 3) Slope m is undefined.
Find the domain and range of the function.g(x) = x² - 5
Sketch the graph of the equation by point plotting.y = √x + 2
Find the domain and range of the function.ƒ(x) = x³
Use the point on the line and the slope of the line to find three additional points that the line passes through. (There is more than one correct answer.) Point (-2,-2) Slope m = 2
Use the point on the line and the slope of the line to find three additional points that the line passes through. (There is more than one correct answer.) Point (1,7) Slope m = -3
Find the domain and range of the function.h(x) = 4 - x²
Find the domain and range of the function.g(x) = √6x
Use a graphing utility to graph the equation. Move the cursor along the curve to approximate the unknown coordinate of each solution point accurate to two decimal places.y = √5 - x(a) (2, y)(b) (x,
Find the domain and range of the function.h(x) = -√x +3
Find an equation of the line that passes through the point and has the indicated slope. Then sketch the line. Point (0, 3) Slope m || 4
Use a graphing utility to graph the equation. Move the cursor along the curve to approximate the unknown coordinate of each solution point accurate to two decimal places.y = x5 – 5x(a) (-0.5, y)(b)
Find an equation of the line that passes through the point and has the indicated slope. Then sketch the line. Point (0, 0) Slope m = ²/
Find an equation of the line that passes through the point and has the indicated slope. Then sketch the line. Point (-5, -2) Slope m is undefined.
Find the domain and range of the function.ƒ(x)=√16 - x²
Find the domain and range of the function. f(t) = sec ㅠㅠ 4
Find any intercepts.y = 2x - 5
Find the domain and range of the function.ƒ(x) = |x - 3|
Find any intercepts.y = 4x² + 3
Find an equation of the line that passes through the point and has the indicated slope. Then sketch the line. Point (3,-2) Slope m = 3
Find an equation of the line that passes through the point and has the indicated slope. Then sketch the line. Point (0,4) Slope m = 0
Find any intercepts.y = x² + x - 2
Find the domain and range of the function. f(x) = x 2 x + 4
Find the domain and range of the function. f(x) = 3 X
Find the domain of the function. x-1^^ + x^^ = (x)ƒ X
Find the domain and range of the function.h(t) = cot t
Find any intercepts. y || 2-√√√x 5r + 1
Find any intercepts.y² = x³ - 4x
Find an equation of the line that passes through the point and has the indicated slope. Then sketch the line. Point (-2,4) Slope m = لما لا 5
Find the domain of the function. f(x)=√√√x² 3x + 2 -
Find any intercepts.y = x√16 - x²
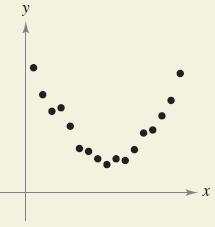
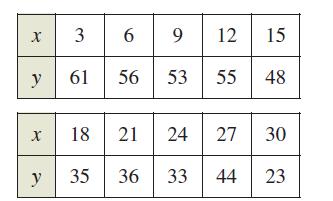
The table shows the populations y (in millions) of the United States for 2004 through 2009. The variable t represents the time in years, with t = 4 corresponding to 2004.(a) Plot the data by hand and
A moving conveyor is built to rise 1 meter for each 3 meters of horizontal change.(a) Find the slope of the conveyor.(b) Suppose theconveyor runsbetween two floorsin a factory. Findthe length of
Find any intercepts.y = (x - 1)√x² + 1
Find any intercepts. y = У x2 + 3x (3x + 1)2
Find the domain of the function. h(x) || 1 sin x (1/2)
Find the domain of the function. g(x) 2 1 - cos x
Find the domain of the function. f(x) = 1 |x + 31
Find any intercepts.x²y - x² + 4y = 0
Find the slope and the -intercept (if possible) of the line.y = 4x - 3
Find any intercepts.y = 2x - √x² + 1
Evaluate the function as indicated. Determine its domain and range.(a) ƒ(-1) (b) ƒ(0) (c)ƒ(2)(d) ƒ(t² + 1) f(x) = = [2x + 1, x < 0 2x + 2, x ≥ 0
Find the domain of the function. g(x) 1 -2 |x² - 41
Find the slope and the -intercept (if possible) of the line.-x + y = 1
Test for symmetry with respect to each axis and to the origin.y = x² - 6
Find the slope and the -intercept (if possible) of the line.x + 5y = 20
Test for symmetry with respect to each axis and to the origin.y = x² - x
Find the slope and the -intercept (if possible) of the line.бу - 5y = 15
Evaluate the function as indicated. Determine its domain and range.(a) ƒ(- 2) (b) ƒ(0)(c) ƒ(1) (d) ƒ(s² + 2) f(x) = [x² + 2, 2x² + 2, x ≤ 1 x > 1
Test for symmetry with respect to each axis and to the origin.y² = x³ - 8x
Find the slope and the -intercept (if possible) of the line.x = 4
Evaluate the function as indicated. Determine its domain and range.(a) ƒ(- 3)(b) ƒ(1)(c) ƒ(3)(d) ƒ(b² + 1) f(x) = [ ]x] + 1, x < 1 -x + 1, x ≥1
Test for symmetry with respect to each axis and to the origin.y = x³ + x
Find the slope and the -intercept (if possible) of the line.y = -1
Test for symmetry with respect to each axis and to the origin.xy = 4
Evaluate the function as indicated. Determine its domain and range.(a) ƒ(- 3) (b) ƒ(0)(c) ƒ(5) (d) ƒ(10) f(x) = √x +4₁ x ≤ 5 [(x (x - 5)², x > 5
Sketch a graph of the equation.y = -3
Sketch a graph of the function and find its domain and range. Use a graphing utility to verify your graph. g(x) = 4 X
Test for symmetry with respect to each axis and to the origin.xy² = - 10
Sketch a graph of the equation.x = 4
Test for symmetry with respect to each axis and to the origin. y = X 2 x² + 1
Test for symmetry with respect to each axis and to the origin.y = 4 - √x + 3
Test for symmetry with respect to each axis and to the origin. y || x² x² + 1
Sketch a graph of the function and find its domain and range. Use a graphing utility to verify your graph.ƒ(x) = 4 - x
Sketch a graph of the equation.y = -2x + 1
Test for symmetry with respect to each axis and to the origin.ху - √4 - x² = 0
Sketch a graph of the equation.y = 1/3x - 1
Sketch a graph of the function and find its domain and range. Use a graphing utility to verify your graph. f(x) = //x³ + 3
Sketch a graph of the function and find its domain and range. Use a graphing utility to verify your graph. f(x) = x + √√√4x²
Sketch a graph of the function and find its domain and range. Use a graphing utility to verify your graph. f(x) = √9-1 9x²
Sketch a graph of the equation.y - 2 = 3/2(x - 1)
Sketch a graph of the equation.y - 1 = 3(x + 4)
Test for symmetry with respect to each axis and to the origin.y = |x³ + x|
Sketch a graph of the function and find its domain and range. Use a graphing utility to verify your graph. h(0) = = - 5 cos 0 2
Sketch a graph of the equation.2x - y - 3 = 0
Test for symmetry with respect to each axis and to the origin.|y| - x = 3
The graph of the distance that a student drives in a 10-minute trip to school is shown in the figure. Give a verbal description of the characteristics of the student’s drive to school. Distance (in
Sketch a graph of the equation.x + 2y + 6 = 0
Find any intercepts and test for symmetry. Then sketch the graph of the equation.y = 2 - 3x
Sketch a graph of the function and find its domain and range. Use a graphing utility to verify your graph.g(t) = 3 sin πt
Find an equation of the line that passes through the points. Then sketch the line.(0, 0), (4, 8)
Find any intercepts and test for symmetry. Then sketch the graph of the equation.y = 2/3x + 1
Use the Vertical Line Test to determine whether is a function of x. x = y² = 0 y 2 1 -1 -27 1 2 3 + 4
Find an equation of the line that passes through the points. Then sketch the line.(-2, -2), (1, 7)
Find any intercepts and test for symmetry. Then sketch the graph of the equation.y = 9 - x²
Showing 100 - 200
of 9871
1
2
3
4
5
6
7
8
9
10
11
12
13
14
15
Last